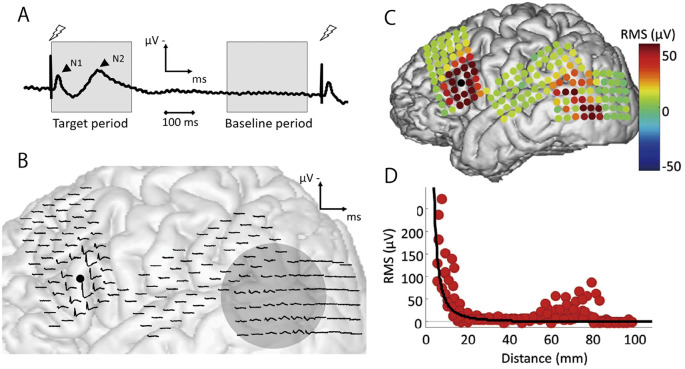
Fig. 2.
(A) An overview of corticocortical evoked potential (CCEP). A CCEP waveform comprises two distinct components: the early N1 and the late N2. (B) (C) The CCEP waveforms obtained through single-pulse electrical stimulation and their signal intensity measured as root mean square. A black dot depicts the point of stimulation. A remote response is observed in the posterior part of the lateral temporal cortex, indicating increased functional connectivity with the stimulated area. Electrodes surrounding the stimulating site elicit a large early peak, signifying cortical excitability. (D) CCEP signal intensity in the vicinity of the stimulation site decays according to the inverse square of the distance, indicating the contribution of the volume-conducted potential. Reprinted from Ref 26, with permission from the journal.

