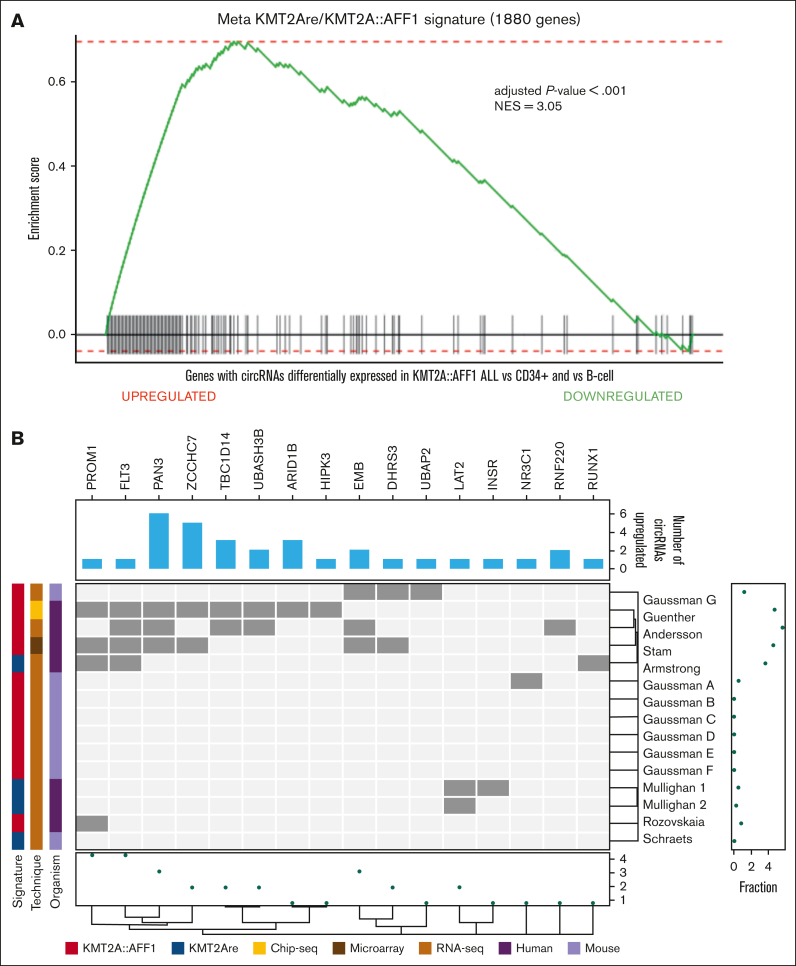
Figure 3.
Relation between circRNAs dysregulated in KMT2A::AFF1 ALL and known KMT2Are signature genes. (A) Custom GSEA of the host genes expressing the 86 circRNAs most dysregulated in KMT2A::AFF1 using custom assembled KMT2Are/KMT2A::AFF1 meta-signature of 1881 genes previously associated with the disease. (B) Bar plot of the number of circRNAs dysregulated in KMT2A::AFF1 expressed from genes belonging to the KMT2Are/KMT2A::AFF1 meta-signature. The heat map shows the genes belonging to each original signature (dark gray); the columns are clustered according to the Dice distance, and the rows according to the Sokal and Michener distance; the marginal dot plots display the number signatures that contain each gene (bottom) and the fraction of genes of each signature that host at least 1 circRNA (right); information about the original signatures considered is given by the left bars. NES, normalized enrichment score.

