Figure 4.
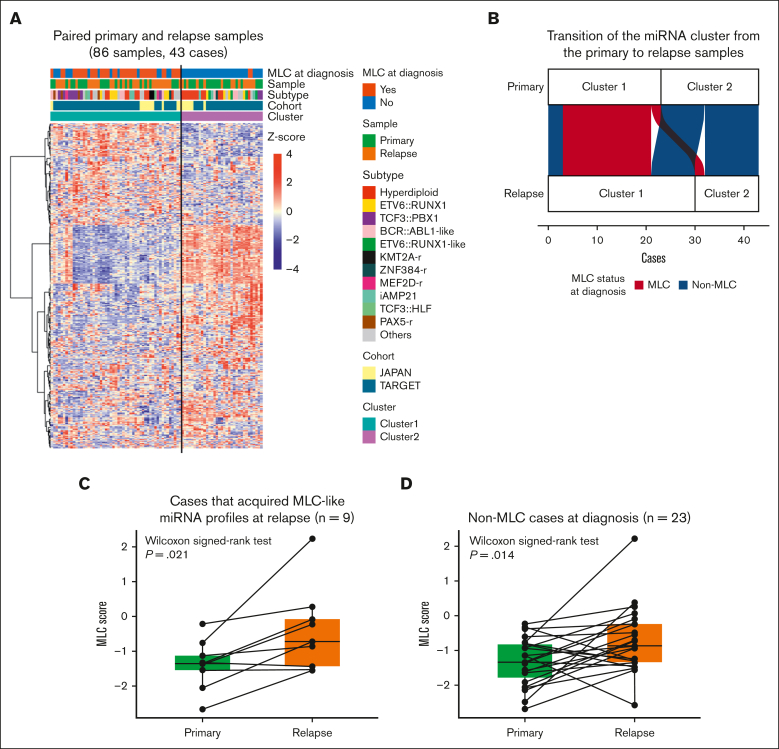
The MLC signature of relapsed BCP-ALL. (A) Heat map showing miRNA expression by 86 paired primary and relapse samples from the TARGET cohort (35 cases) and the Japanese cohort (8 cases), along with clinical information for each case. Two clusters were identified by consensus clustering of the 86 samples using 400 miRNAs (the distance method, Pearson). Primary samples with an MLC or MLC-like signature are denoted as MLC at diagnosis. (B) An alluvial plot illustrates the transition of the miRNA cluster from the primary to relapse samples from 43 cases; red indicates primary samples classified as MLC (20 cases), and blue indicates those classified as non-MLC (23 cases). (C-D) Box plots comparing the MLC scores between paired primary and relapse samples (C) in the 9 cases that acquired MLC-like miRNA profiles at relapse, and (D) in the 23 non-MLC cases at diagnosis. P values are calculated using the Wilcoxon signed-rank test.

