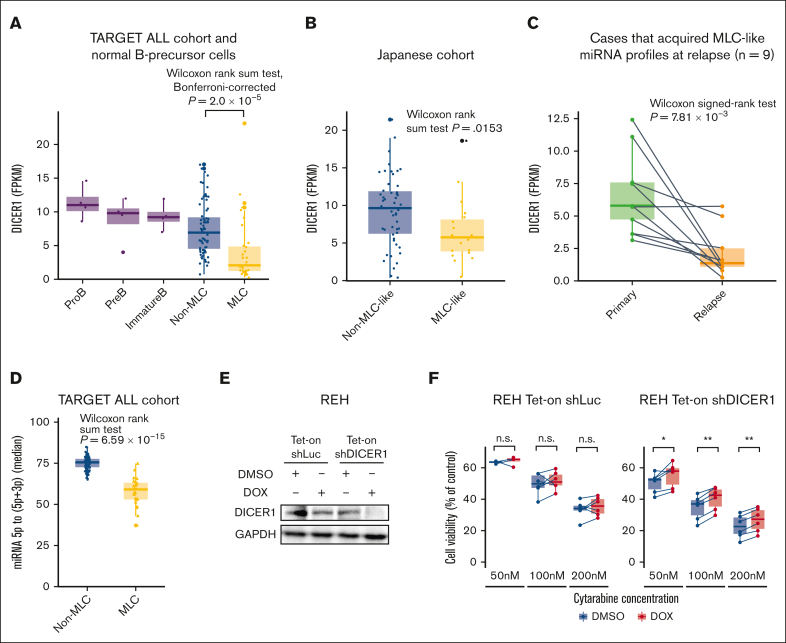
Figure 6.
DICER1 expression in BCP-ALL. (A) Box plots comparing DICER1 expression (expressed as FPKM) by normal pro–B cells (n = 4), pre–B cells (n = 4), immature B cells (n = 4), non-MLC cases (n = 80), and MLC cases (n = 31) from the TARGET ALL cohort. The P value was calculated using the Wilcoxon rank-sum test, adjusted using Bonferroni-correction. (B) Box plots comparing DICER1 expression (FPKM) in non-MLC-like cases (n = 50) and MLC-like cases (n = 19) from the Japanese cohort. The P value was calculated using the Wilcoxon rank-sum test. (C) Box plots comparing DICER1 expression (FPKM) in paired primary and relapse samples from 9 cases that acquired an MLC signature at relapse. The P value was calculated using the Wilcoxon signed-rank test. (D) Box plots showing quantification of miRNA processing, based on the median 5p to (5p + 3p) miRNA ratio in non-MLC cases (n = 80) and MLC cases (n = 31) from the TARGET ALL cohort. The P value was calculated using the Wilcoxon rank-sum test. (E) Immunoblotting to detect DICER1 and GAPDH expression by REH cells transduced with control (shLuc) or DICER1 short hairpin RNAs (shDICER1). Cells were treated for 72 hours with 3 μM doxycycline (DOX) or an equivalent amount of dimethyl sulfoxide (DMSO). (F) Box plots comparing the viability of REH cells transduced with control or shDICER1 after exposure to cytarabine. REH cells were transduced with shLuc or shDICER1 and then cultured in the presence of 3 μM doxycycline, or an equivalent amount of DMSO, for 72 hours. After the indicated concentrations of cytarabine were added to the culture medium, cell viability (%) relative to that of control wells containing culture medium and the equivalent amount of vehicle was measured after 48 hours in a water-soluble tetrazolium 8 (WST-8) assay using Cell Counting Kit-8 (n = 6). P values were calculated using the Wilcoxon signed-rank test. ∗P < .05, ∗∗P < .01. FPKM, fragments per kilobase million; GAPDH, glyceraldehyde-3-phosphate dehydrogenase.

