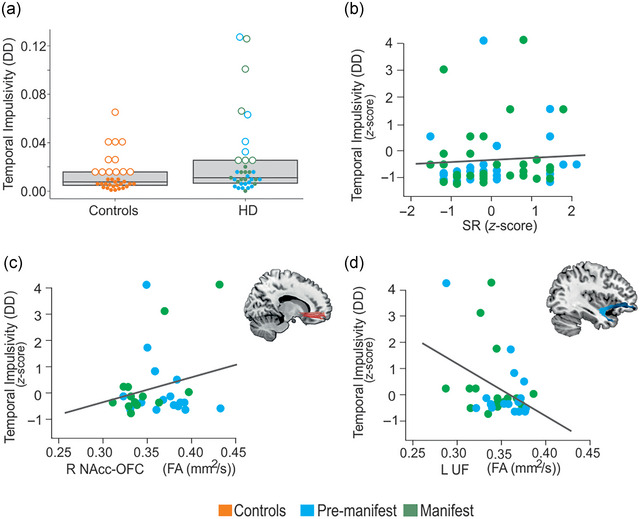
FIGURE 1.

Behavioral and microstructural modulations of temporal impulsivity in Huntington's disease (HD). (A) Impulsivity scores between the controls and HD group: Scatterplot of behavioral correlates displaying the impulsivity scores between HD patients (premanifest and manifest combined) and controls. Box plots indicate the first, second (median), and third quartile limits. Individuals in the fourth quartile are marked with an empty circle, and individuals in other quartiles are marked with solid dots. (B) The relationship between impulsivity levels and SR (β = .007, p = .027). (C) The relationship between impulsivity levels and white matter disturbance in the two tracts of interest—the right NAcc‐OFC FA (β = .029, p = .002) and left UF FA (β = −.039, p = .015). The two scatterplots display the significant association obtained in the multiple regression model between impulsivity and FA in the right accumbofrontal fasciculus (NAcc‐OFC) and left uncinate fasciculus (UF). Lower FA values indicate more severe damage to white matter microstructure. Linear regression line is fit for illustration in each scatterplot. DD, delay discounting, temporal impulsivity scores; FA, fractional anisotropy; R NAcc‐OFC, right accumbofrontal tract; SR, sensitivity to reward; L UF, left uncinate fasciculus.
