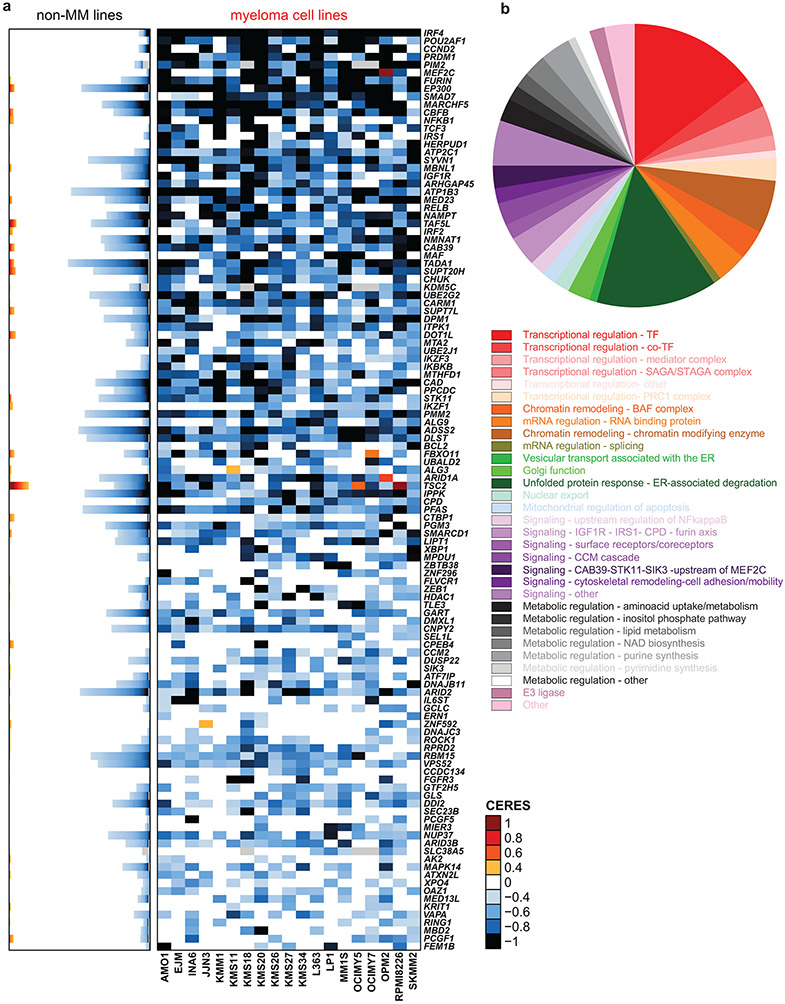
Figure 1 ∣. Myeloma–preferential dependencies identified by genome-scale CRISPR-based gene-editing screens.
a, Color-coded heatmaps depict CERES scores, as a quantitative metric of dependence of human tumor cell lines to each gene in CRISPR/Cas9 gene-editing screens (AVANA sgRNA library). CERES scores for MM lines (n=19) are depicted as a matrix (right side of graph) of cell lines (in columns) and genes (in rows). For non-MM lines (n=770), data are depicted for each gene (row) in stacked bar graphs, which visualize the CERES score of each gene in descending order (from left to right). Black or dark blue signifies negative CERES scores compatible with pronounced sgRNA depletion of a given gene for a specific cell line. MM-preferential dependencies were identified based on average CERES scores in MM cell lines ≤−0.2; difference in average CERES scores in MM vs. non-MM lines ≤−0.2; two-sided limma t-test with adjusted p-value (FDR) <0.05 for comparison of CERES scores; and additional criteria outlined in Methods. b, Pie chart of the distribution of MM-preferential dependencies to different functional groups, pathways, or biological functions.

