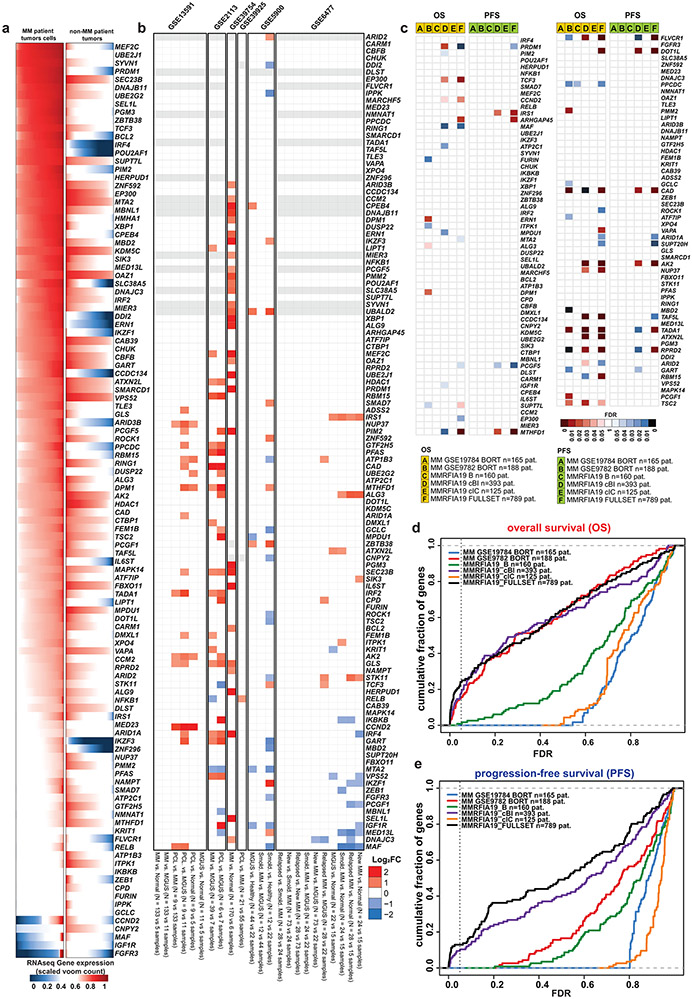
Extended Data Figure 4 ∣. Patterns of transcript levels for MM-preferential dependencies in different biological or clinical contexts.
a, RNA-Seq data for MM-preferential dependencies in patient-derived tumor samples for MM vs. non-MM. Transcript levels (presented as stacked plots) for each gene (row) across MM (n=591 samples; MMRF CoMMpass study, IA8 release) and non-MM (n=11060 samples, TCGA; accessed from GDAC). Raw counts were voom normalized, negative voom values were set to zero, scaled by maximum value for each gene, resulting in a value range between 0 and 1. Concordant observations also obtained with other versions of MMRF and TCGA datasets. b, Comparative analyses of transcript levels for MM-preferential dependencies in different stages of myelomagenesis or settings with distinct differences in clinical or biological aggressiveness of MM. Heatmap summarizes results from comparisons performed between groups of samples within each of the gene expression profiling datasets indicated in the figure. Red and blue denote statistically significant (FDR<0.05, Limma t-test, log2FC > 1.0 or < −1.0) up- or down-regulation, respectively, for a gene in a given group of samples vs. its indicated comparator group. Genes in gray do not have perfect match probes in the respective array. White indicates no statistically significant difference for a given comparison. Number of samples per group is indicated next to each comparison. c-e, Transcript levels of most MM-preferential dependencies do not consistently correlate with adverse clinical outcome. c, Overall survival (OS) or progression free survival (PFS) were examined for MM patients at high vs. intermediate vs. low tertiles of expression of each MM-preferential dependency in each dataset indicated in the graph (see Methods). Red and blue denote statistically significant (at FDR<0.05, two-sided log-rank test) correlation of transcript levels for a given gene with adverse or favorable, respectively, clinical outcome (white indicates FDR>0.05). d-e, Cumulative plots summarizing results of c, in terms of OS (d), or PFS (e), between MM patients with high vs. intermediate vs. low tertile of expression of each gene in each dataset indicated in the graph. For each potential FDR value (x-axis), the y-axis depicts, separately for OS or PFS in each dataset, the cumulative fraction of MM-preferential dependencies exhibiting FDR levels equal or lower to those depicted in each respective position of the x-axis. For all evaluated datasets, <25% of MM-preferential dependencies exhibit FDR<0.05 for the correlation of transcript levels with PFS or OS. Number of patient samples in c-e is indicated for each dataset.

