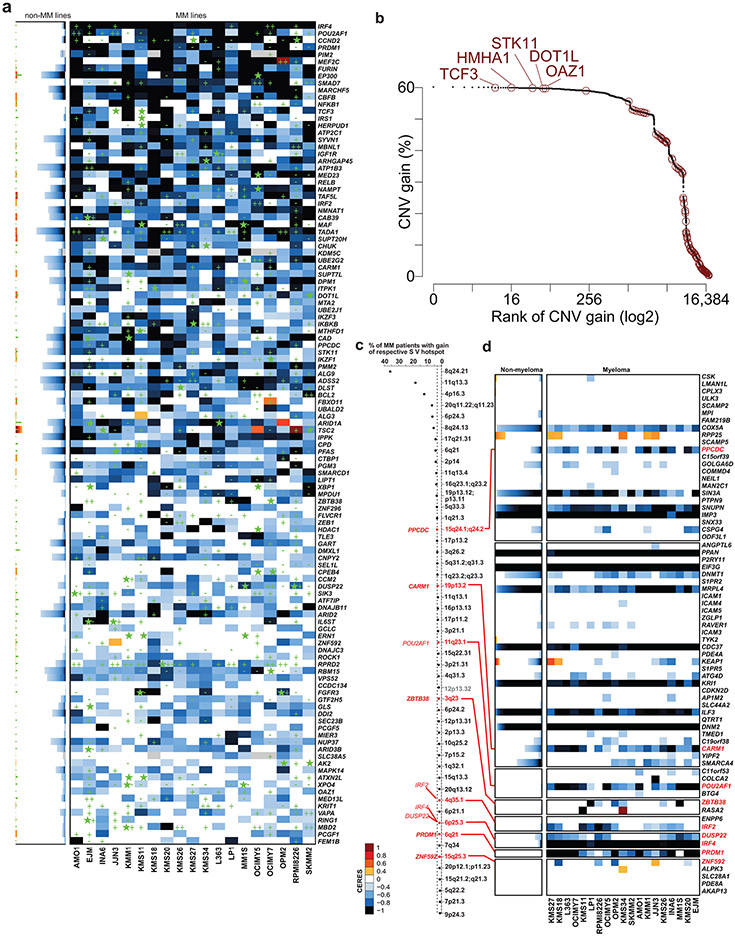
Extended Data Figure 5 ∣. Genomic landscape of MM-preferentially essential genes.
a, Mutational and DNA copy number data for MM-preferential dependencies in MM vs. non-MM cell lines is included in heatmaps of CERES scores (similar to the format of Fig. 1a). Green stars represent non-synonymous mutations; while CNV gains and losses are depicted by “+” or “−”, respectively. In stacked plots for non-MM cell lines, green stars are also stacked and are not linked with the CERES scores in respective lines. b, Rank of genes with most frequent CNV gains in MM patient tumor samples (N = 932 samples; N = 18,057 genes with CERES data (20Q4v2) and CNV data in CoMMpass study, IA15 release): MM-preferential dependencies are highlighted in red and their gene symbols are labeled for those MM-preferential dependencies ranked in the top 200 genes (genes are ranked on the x-axis on a log2 scale). c, Top hotspots for gain of structural variants (SVs) ranked based on their frequency in MM patient tumor samples (CoMMpass study), derived from analyses of Rustad et al13. MM-preferential dependencies residing in 8 of these hotspots are highlighted, and those in bold have not been previously proposed as candidate drivers of the respective hotspots. Gray denotes hotspots which contain no genes evaluated in the genome-scale CRISPR screens. d, Heat maps for CERES scores in MM vs. non-MM lines of genes in each of the 8 SV gain hotspots of panel c that contain MM-preferential dependencies.

