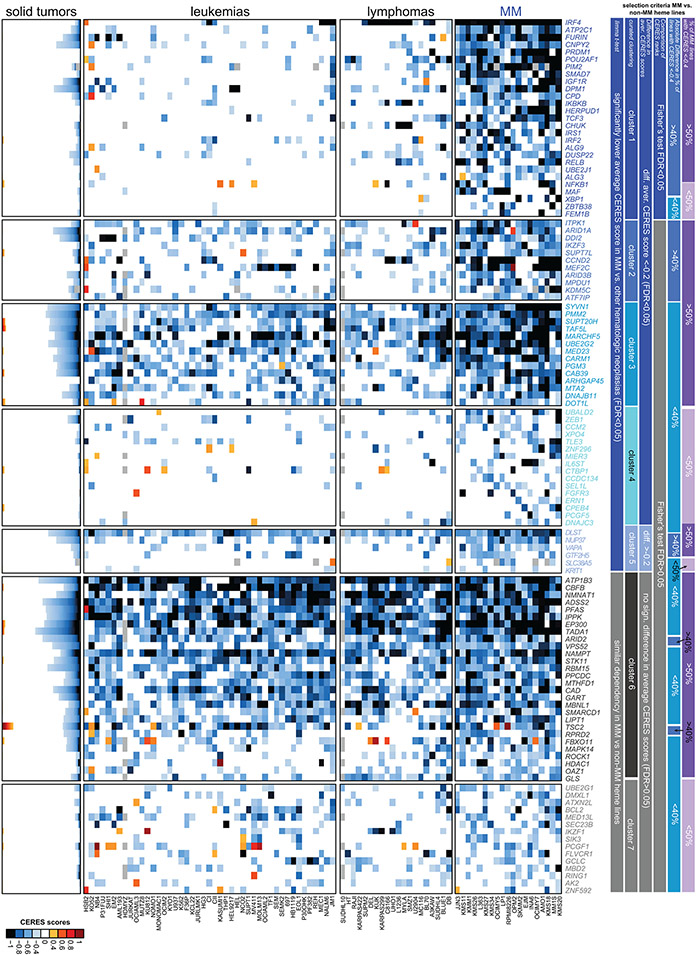
Extended Data Figure 7 ∣. Comparative analysis of CERES scores for MM preferential dependencies in MM vs other hematologic malignancies vs. solid tumors.
Results are presented in a manner similar to Fig. 1, with stacked bar plots for solid tumors (left); separate matrices for cell lines from non-MM hematologic malignancies (middle) vs. MM (right). Genes are included in 7 different clusters determined based on the criteria included in the color-coded bars on the right-hand side of the graph (FDR of comparison of CERES scores and difference in average CERES scores in MM vs. non-MM hematologic cell lines; Fisher’s test FDR for comparison of CERES ranks; absolute difference in % of MM vs. non-MM hematologic cell lines with CERES scores ≤ −0.4; and % of MM lines with CERES score ≤ −0.4). Results highlight that several MM-preferential dependencies are shared between MM and other hematologic malignancies, but many others are preferentially essential only for MM cell lines, a statement also supported by results of Extended Data Fig. 8.

