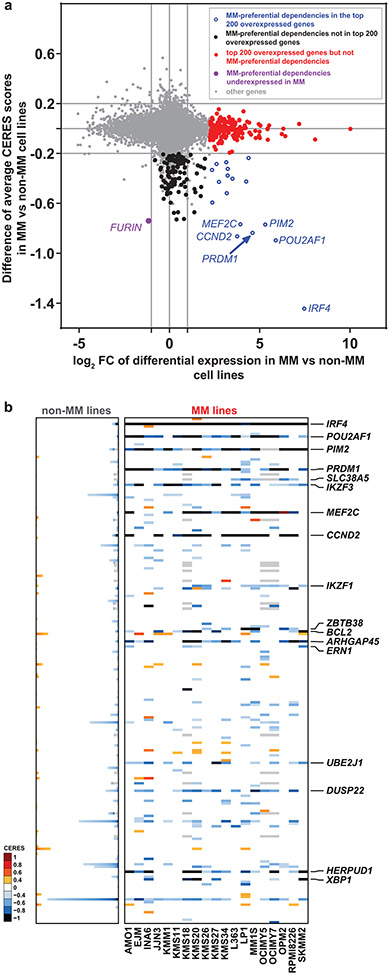
Figure 3 ∣. Most MM-preferential dependencies do not rank among the top overexpressed genes in MM vs non-MM cell lines.
a, Scatter plot depicting for each gene the log2FC of differential expression in MM (n=25) vs. non-MM (n=991) cell lines in CCLE (x-axis) vs. average differences in CERES score (y-axis, see Supplementary Table 1) in MM vs non-MM lines in CRISPR gene editing screens (N = 17,436 genes with matching gene symbols between CCLE and CERES data). The plot highlights genes that are (i) preferentially essential and in the top N = 200 overexpressed genes (log2FC>1.0, two-sided limma t-test, FDR<0.05, ranking based on log2FC) in MM (blue circles); (ii) the top N = 200 overexpressed genes that are not preferentially essential in MM (red dots); (iii) a MM-preferential dependency that is under-expressed (log2FC<−1.0, FDR<0.05) in MM vs. non-MM cell lines in CCLE (purple dot); (iv) other MM preferential-dependencies that are not in the top N = 200 overexpressed genes (black dots) and (v) other genes (gray dots). b, Heat-maps for MM (N = 19 cell lines) (right; matrix) and non-MM (N = 770 cell lines) (left; stacked bars) depict CERES scores of the top N = 200 most upregulated genes in MM vs. non-MM cell lines (CCLE) for which both transcript and CERES data are available (significantly upregulated genes were ranked according to log2FC of differential expression, distinctly from the FDR-based ranking of differentially expressed genes for Fig. 2). Gene symbols are depicted for the minority of top upregulated genes that represent MM-preferential dependencies. Gene expression data for a, was accessed from the initial CCLE portal, with concordant observations based on subsequent releases of these data through DepMap portal.

