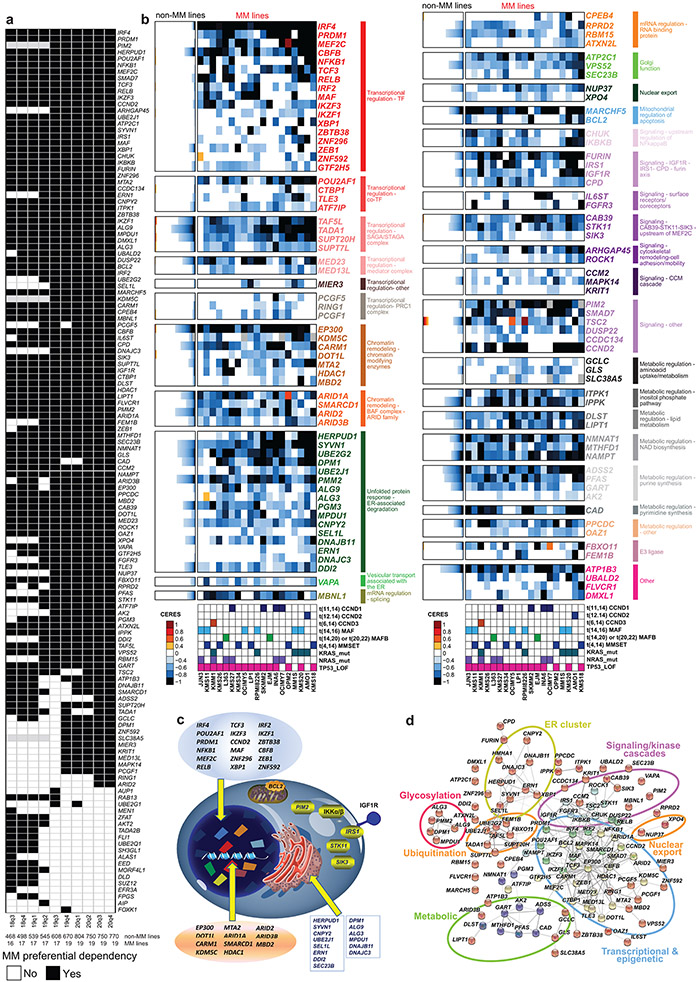
Extended Data Figure 1 ∣. MM-preferential dependencies in genome-scale CRISPR-based gene editing screens.
a, Summary matrix of results for identification of MM-preferential dependencies in genome-scale CRISPR-based gene-editing screens from different releases of the Dependency Map program. The criteria used to identify MM preferential dependencies in the 20Q4v2 Dependency Map data were also applied in earlier releases (18Q3 to 20Q3). The matrix summarizes results for all genes that met these criteria in at least one of the releases. Black or white indicate, respectively, that a gene did vs. did not meet criteria for MM preferential dependency in the respective data release (gray signifies that CERES scores were not calculated for a given gene in the data release). b, MM-preferential dependencies clustered according to molecular pathways represented in this group of genes. Color-coded heatmaps for CERES scores following the format of Fig. 1a. Genes are clustered based on their related functional groups, pathways, or biological functions, based on aggregate information from the literature. c-d, Molecular pathways enriched for MM-preferential dependencies. c, Schematic representation of functional groups represented in the MM-preferential dependencies, such as transcription factors/co-factors, other regulators of transcriptional responses and chromatic signaling; kinases serving as upstream regulators of these pathways (e.g., kinases activating NF-κB); or endoplasmic reticulum/Golgi regulators. d, Visualization of the direct (physical) and indirect (functional) associations of the MM-preferential dependencies, based on computational prediction, knowledge transfer between organisms, interactions aggregated from other (primary) databases or other resources integrated and visualized by the online STRING database (https://string-db.org/, v11.0)67.

