Figure 1.

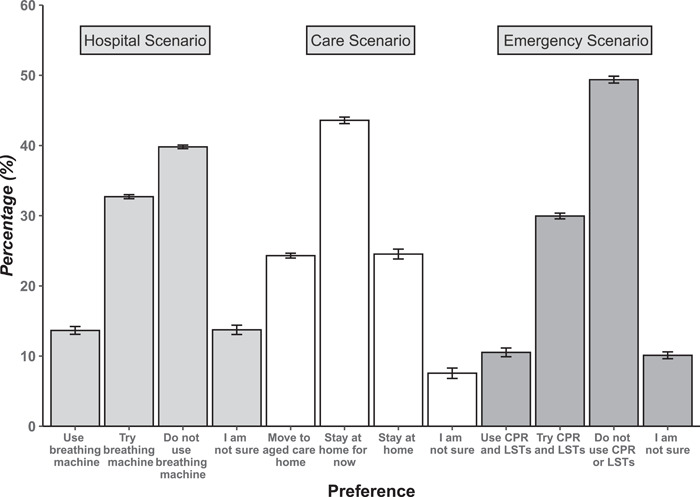
Proportion of participants selecting each of four response options in the three care and treatment scenarios. Figure shows the mean count scores from 10 imputed datasets, with 95% confidence intervals around the point estimate.

Proportion of participants selecting each of four response options in the three care and treatment scenarios. Figure shows the mean count scores from 10 imputed datasets, with 95% confidence intervals around the point estimate.