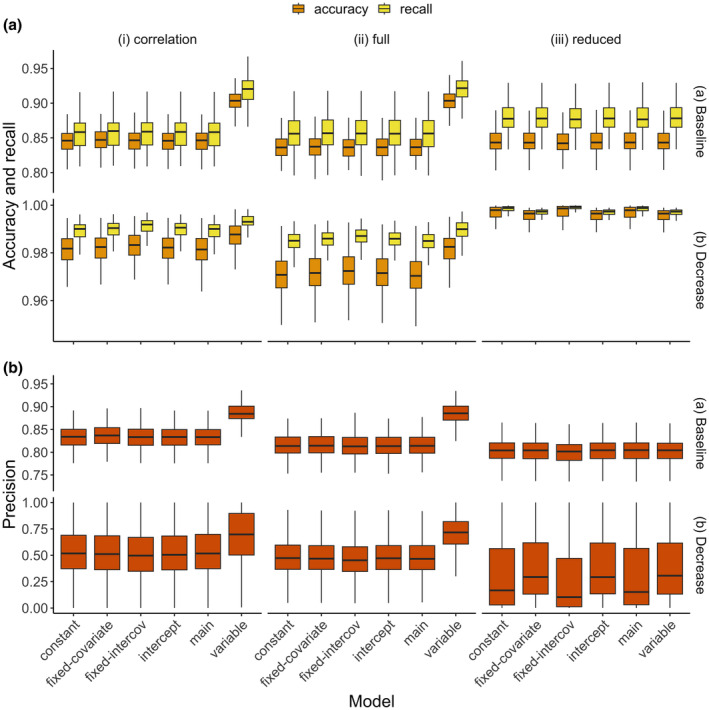
FIGURE 1.

Boxplot of validation metrics (accuracy, precision, recall) from the six study models defined in Table 2 on the two hundred (200) withheld samples out of the thousand (1000) samples simulated in each dataset. Accuracy is the proportion of withheld samples that were correctly classified, recall is the proportion of correctly classified samples that were retrieved from the withheld samples, and precision is the proportion of the misclassified samples that were correctly classified. Each boxplot shows the median and the interquartile range (25–75% quartiles). Each column shows the type of model used to simulate the dataset: ‘full’ refers to using the variable/covariate model in Table 2, ‘reduced’ refers to using the intercept model in Table 2 and ‘correlation’ refers to using the variable model in Table 2, but with correlated ecological and observation process covariates. The rows correspond to changes made to the number of misclassified samples in the simulated dataset: ‘Baseline’ refers to using the values defined in Section 2.4 and ‘Decrease’ refers to reducing the number of misclassified samples by diagonal elements of by 6 as described in Section 2.4.
