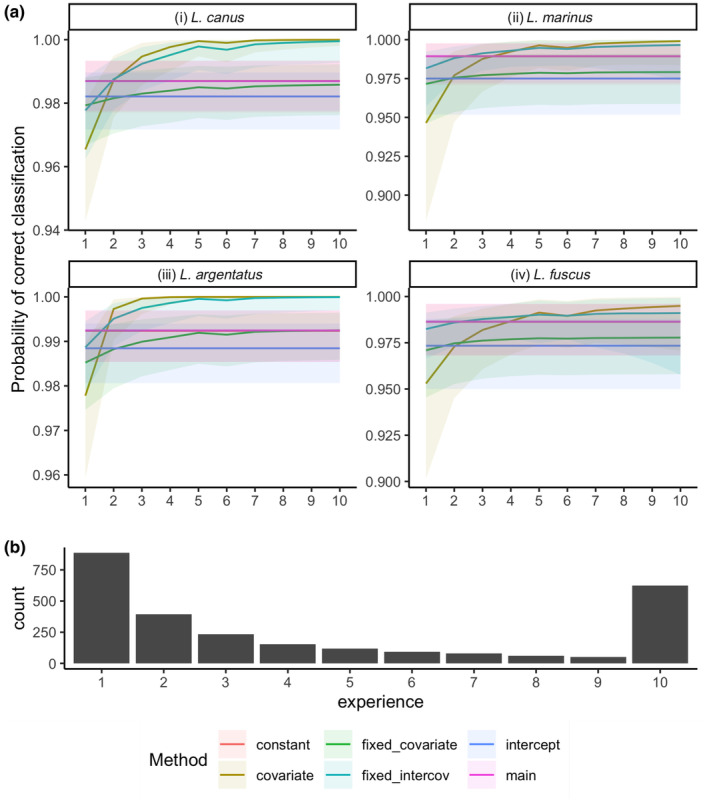
FIGURE 2.

Summary of results from the model fit to gull dataset showing (a) Probability of correct classification for the common (Larus canus), herring (Larus argentatus), great black‐backed (Larus marinus) and lesser black‐backed gulls (Larus fuscus) and (b) the distribution of the experiences of the observers used in the modelling. The ribbon around the correct classification probability estimates represents the 95% credible interval of the estimates.
