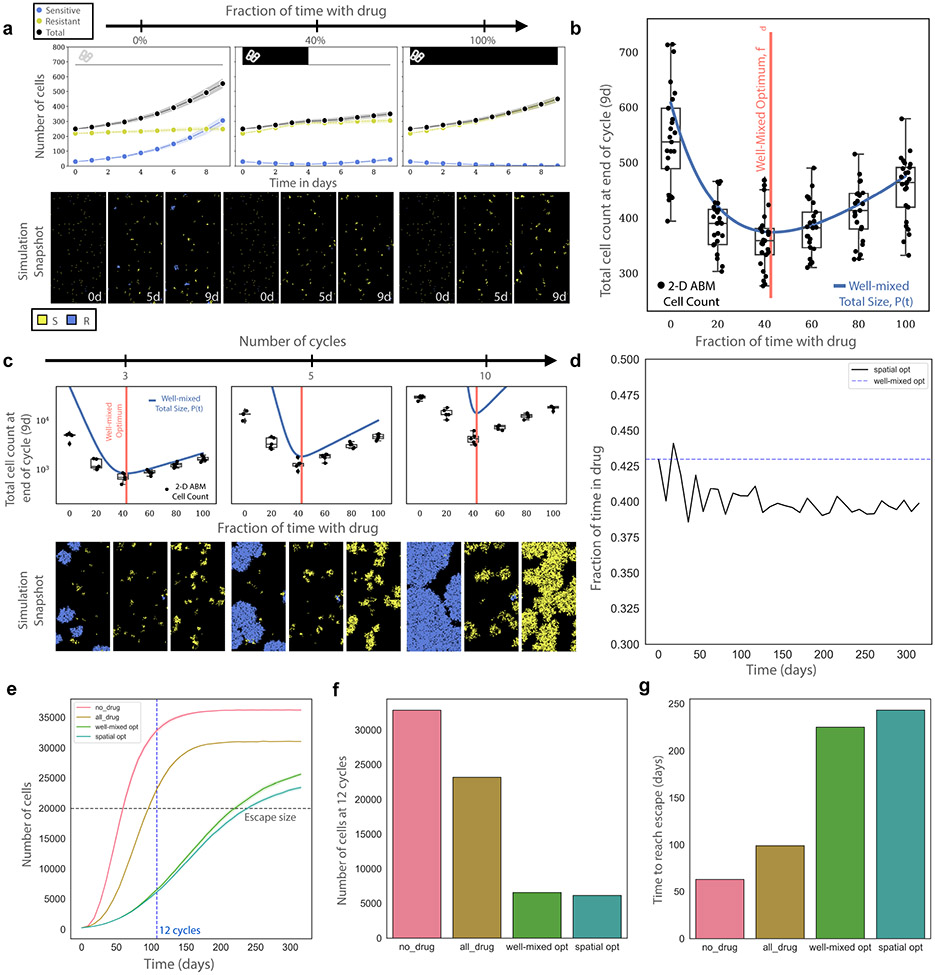
Fig 6: Optimal schedules derived from a well-mixed model approximate those derived from an agent-based model incorporating cell turnover, spatial competition, and carrying capacity.
a, Representative ABM simulations depicting 0% drug treatment, 40% drug treatment, and 100% drug treatment schedules for one drug cycle, or 9 days. Blue cells (lines) represent sensitive cells while yellow cells (lines) represent resistant and dependent cells. Cell death/turnover is equal for all cell types and drug concentrations and is equal to half the sensitive populations drug-free growth rate. b, Similar to a but with 25 replicates and additional treatment schedules (0, 20, 40, 60, 80, 100 percent time in drug). ABM simulations (black dots, box and whisker plots) show broad agreement with the well-mixed model experimental model prediction (blue line). The predicted well-mixed optimal (red vertical line) captures the simulations well. Data is presented as such; mean is center solid line and the 95% confidence interval is the shaded band above and below the mean c, Simulations similar to a and b, but the simulations continue for 3, 5, and 10 cycles of treatment (each cycle is one 9-day schedule). d, Using the data from c we calculate the optimal treatment after each 9 day treatment schedule and how it varies as the populations compete for space. This result is deemed the “spatial optimal.” e, Simulations comparing the total population size over time using the well-mixed optimal, spatial optimal, 100% drug, and 0% drug. f, Comparison of total cells after 12 cycles (blue dotted line in e, the last cycle before the worst condition reaches carrying capacity) reveals an ~8% decrease in cell count of the spatial optimal in comparison to the well-mixed optimal. g, Comparison of the time to reach treatment escape (grey horizontal line in e) reveals the spatial optimal extends treatment success for an additional ~8%. b, c, Box plot elements are defined as follows: centre line, median; box limits, upper and lower quartiles; whiskers, 1.5 × interquartile range.

