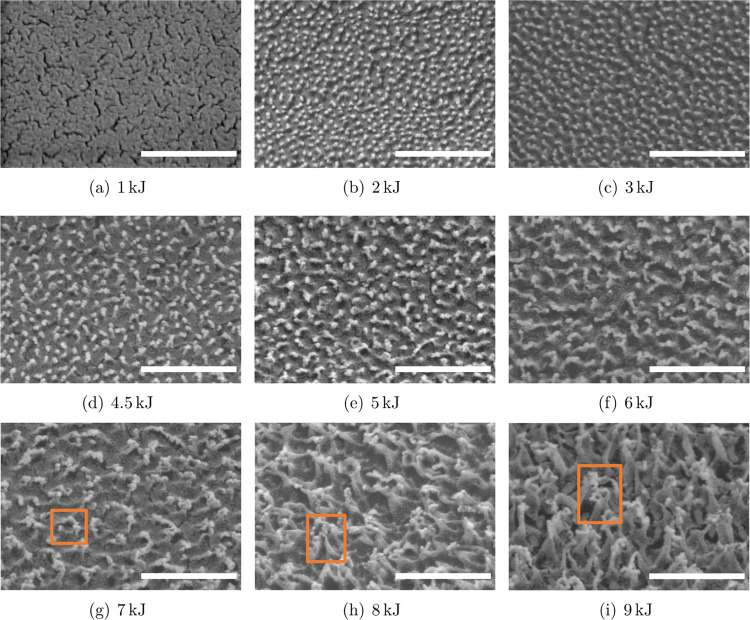
Figure 2.
SEM images of Teflon AF1600 surfaces treated by oxygen plasma with energies of (a) 1, (b) 2, (c) 3, (d) 4.5, (e) 5, (f) 6, (g) 7, (h) 8, and (i) 9 kJ. All images are taken by tilting the samples by 30°. The length of the white bar in each image represents 500 nm. The framed area indicates the presence of nanosized structures with undercuts.

