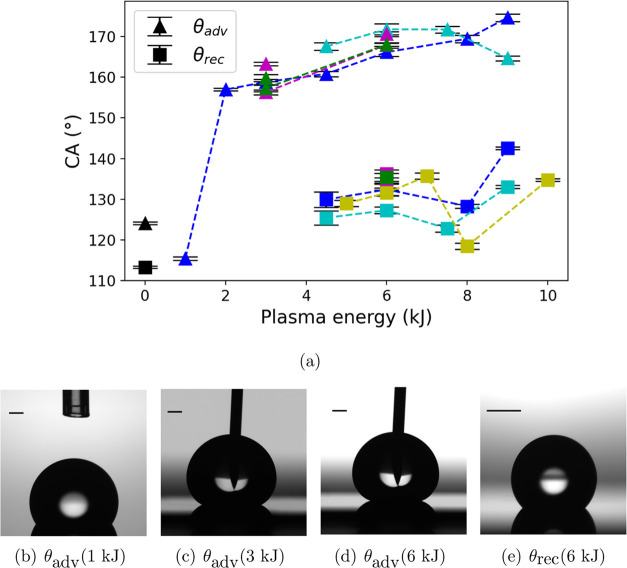
Figure 5.
(a) The advancing (triangle points) and receding CA (rectangular points) as a function of the plasma energy at T = 25 °C. The points in black represent the θadv and θrec on pristine Teflon AF1600.3 Points in other colors represent CAs on the oxygen plasma-treated surface with different treatment parameters, and the color coding is identical to that shown in Figure 1. (b) Representative image of water droplets on surfaces treated with a plasma energy of 1 kJ: θadv = 114.7°; (c) plasma energy of 3 kJ: θadv = 159.2°; (d) plasma energy of 6 kJ: θadv = 170.2°; (e) plasma energy of 6 kJ: θrec = 132.5°. The black bar represents 1 mm. Part of the data (on pristine surfaces) are reproduced from [Temperature Dependence of Water Contact Angle on Teflon AF1600]. Copyright [2022] American Chemical Society.

