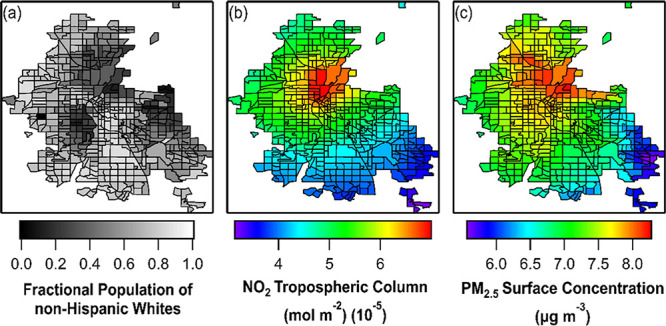
Figure 1.

Map of the Denver Metroplex population fraction of people who identify as non-Hispanic White (a) where lightly shaded areas have higher proportions of people who identify as non-Hispanic White and darkly shaded areas have higher proportions of people who identify as a person of color. Representative NO2 tropospheric column (b) and PM2.5 surface concentration (c) maps. Black lines are census tracts contained within Denver’s UA.
