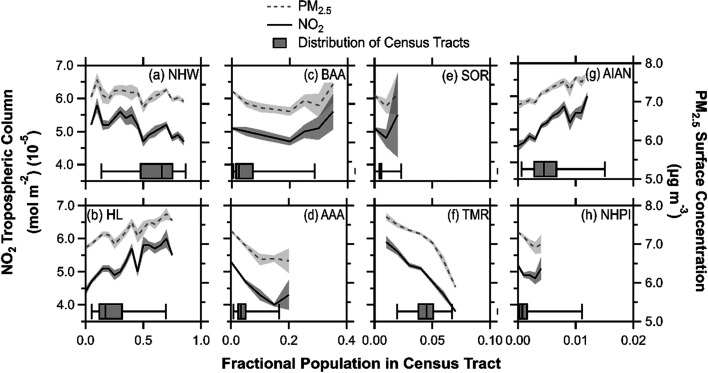
Figure 2.
Binned averages for every specified fraction of a particular demographic group showing increase or decrease of the NO2 tropospheric column and PM2.5 surface concentration with increasing population fraction. Bins are 0.05 fractional increase for non-Hispanic White; Hispanic or Latino; Black and African American; and Asian and Asian American groups, 0.01 for some other race and two or more races groups, and 0.001 for American Indian and Alaska Native and Native Hawaiian and Pacific Islander groups. Shaded regions depict standard error. Box and whisker plots depict the distribution of census tract fractions. Vertical line is the median, boxes are middle quartiles, and whiskers are 2nd and 98th percentile. Box and whiskers may not line up with pollutant lines due to population binning. Abbreviations: NHW: non-Hispanic White, HL: Hispanic or Latino, BAA: Black and African American, AAA: Asian and Asian American, SOR: Some other race, TMR: Two or more races, AIAN: American Indian and Alaska Native, NHPI: Native Hawaiian and Pacific Islander.

