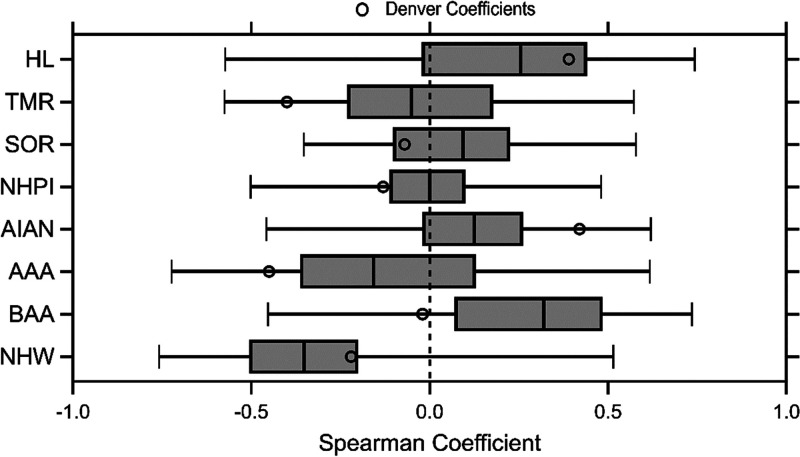
Figure 3.
Distribution of Spearman coefficients in the UA of 150 redlined cities shows moderately negative correlation between TROPOMI NO2 columns (0.01° × 0.01° resolution) and non-Hispanic White population fraction and weak-moderate positive correlations between all other demographic groups. Vertical line shows median; boxes show middle quartiles, and whiskers show the 2nd and 98th percentile. Open circles show the Denver Spearman coefficients. Abbreviations: HL: Hispanic or Latino, TMR: two or more races, SOR: some other race, NHPI: Native Hawaiian and Pacific Islander, AIAN: American Indian and Alaska Native, AAA: Asian and Asian American, BAA: Black and African American, NHW: non-Hispanic White.

