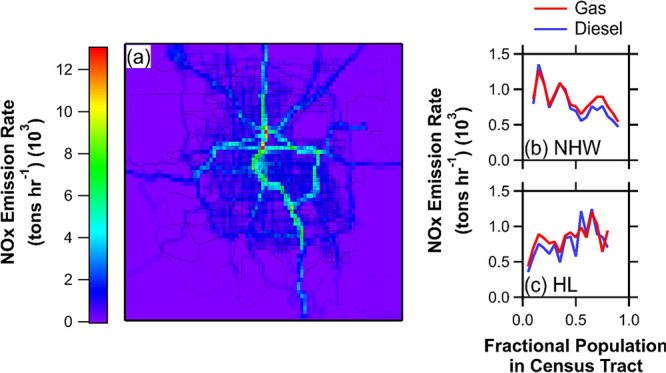
Figure 5.

Averaged FIVE data mapped to census tracts and compared to fractional populations show that vehicle emissions are higher in census tracts with a higher proportion of people who identify as Hispanic and Latino. The map (a) shows the NOx emission rate at a resolution of 1.3 km averaged over 1 year. NOx emission rate averaged across census tracts compared with the fractional populations of non-Hispanic White (NHW) (b) and Hispanic and Latino (HL) (c) groups.
