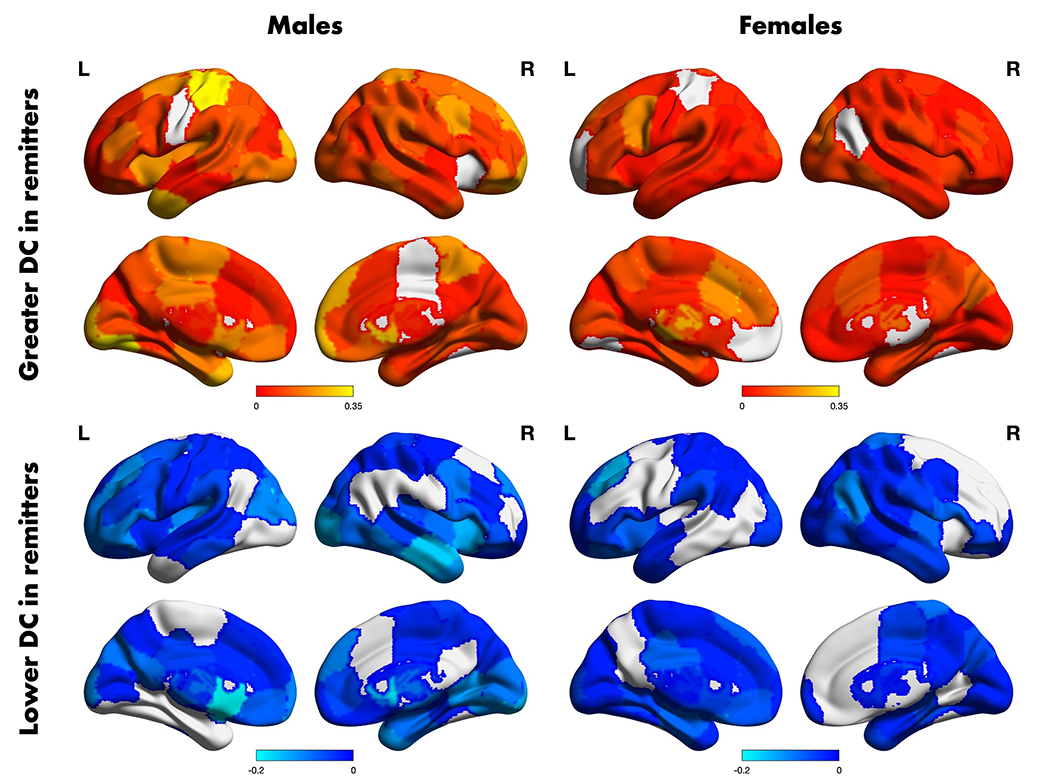
Figure 3. Regional differential connectivity summary differences between remitters and non-remitters according to sex.

The t-statistic map of the region-wise average positive (top row) and negative (bottom row) differences in day 1 differential connectivity among remitters and non-remitters according to sex. Only edges with p < 0.05 (uncorrected) were included in the average. Figures were visualized using the BrainNet Viewer software in Matlab v. 2020b.
