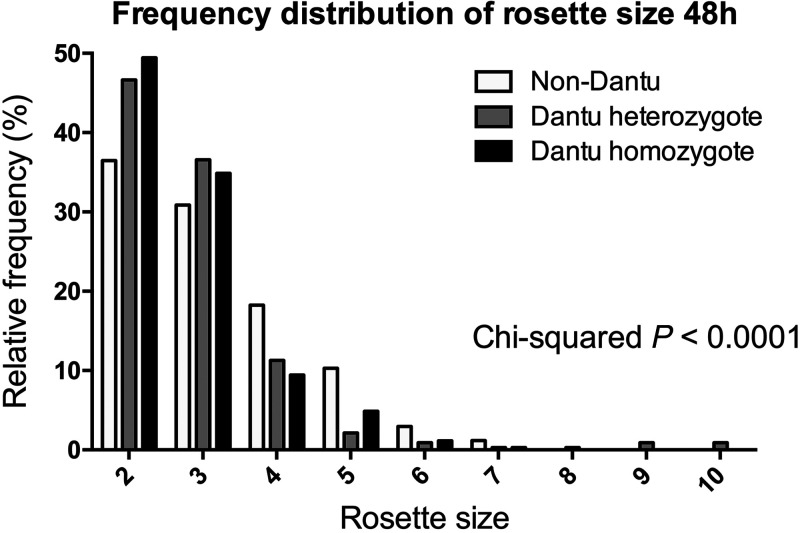
Figure 4.
Frequency distribution of rosette size at 48 hours differs among genotypes. The rosette size data for donors within each genotype were pooled, and the relative frequency of rosettes in each size category (expressed as a percentage of all rosettes) is shown for Dantu homozygous, Dantu heterozygous, and non-Dantu donors. Rosette size indicates the number of uninfected erythrocytes in each rosette. Statistical comparison between groups was performed using a Chi-squared test, P < 0.0001.

