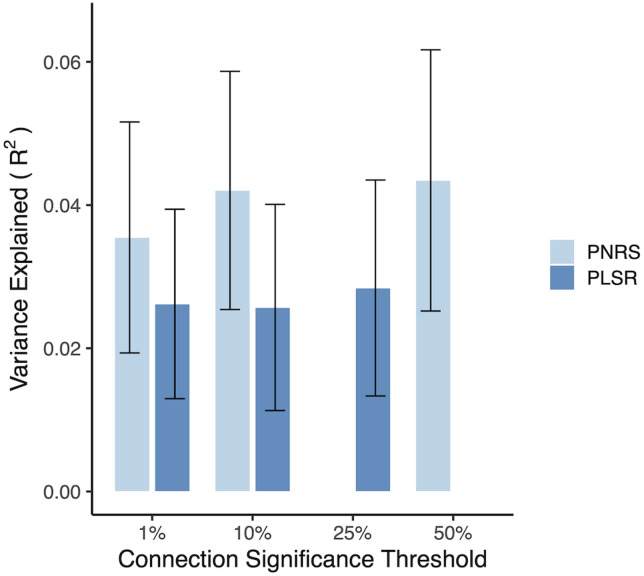
Figure 10.
The proportion of ADHD symptom score variance explained by both the PNRS and the PLSR model in the Oregon baseline cohort (without adjusting for covariates). Due to the computational complexity of the PLSR, that model was fit with a maximum of 25% of the most significant functional connections. Nevertheless, the two methods provide comparable predictive power across various connection inclusion thresholds, suggesting there is no meaningful benefit from the more complex PLSR model. Bootstrapped standard errors are shown.

