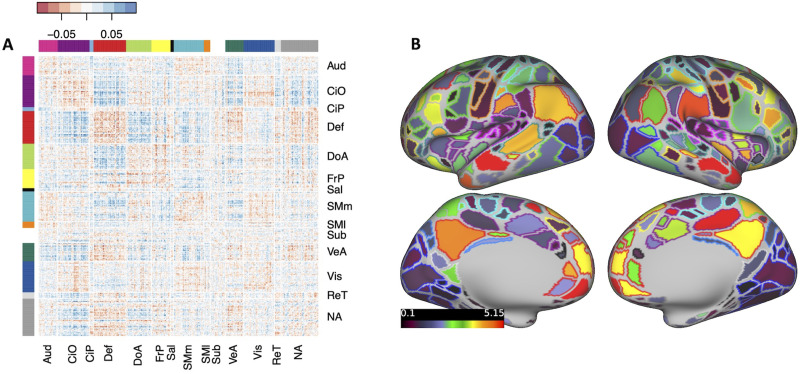
Figure 3.
Brain-wide connectivity associated with ADHD symptoms in the ABCD Study cohort. A, The matrix of standardized regression coefficients showing the strength of association between all connections (organized by brain network) and ADHD symptoms. B, Gordon parcellation showing the relative contribution of each brain network to the ADHD PNRS. Only the top 10% most significant connections (representing the most predictive PNRS) are considered. The fill color represents the sum of the absolute value of β weights for all connections in which a parcel participates; the outline color represents network assignment. Aud, auditory; CiO, cingulo-opercular; CiP, cingulo-parietal; Def, default mode; DoA, dorsal attention; FrP, frontoparietal; Sal, salience; SMm, somatomotor medial; SMl, somatomotor lateral; Sub, subcortical; VeA, ventral attention; Vis, visual; ReT, retrosplenial temporal; NA, not assigned.

