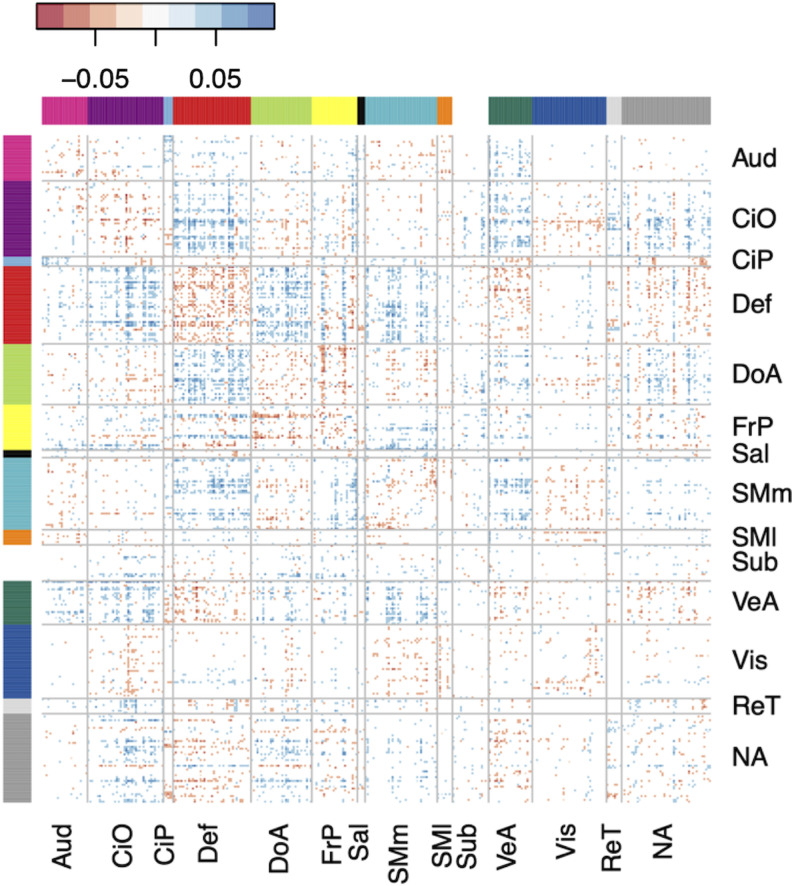
Figure 7.
The matrix of standardized, motion-adjusted regression coefficients showing the strength of association between the top 10% most significant connections (organized by brain network) and ADHD symptoms. The regression coefficients shown here are from a BWAS that included mean FD as a covariate. Aud, auditory; CiO, cingulo-opercular; CiP, cingulo-parietal; Def, default mode; DoA, dorsal attention; FrP, frontoparietal; Sal, salience; SMm, somatomotor medial; SMl, somatomotor lateral; Sub, subcortical; VeA, ventral attention; Vis, visual; ReT, retrosplenial temporal; NA, not assigned.

