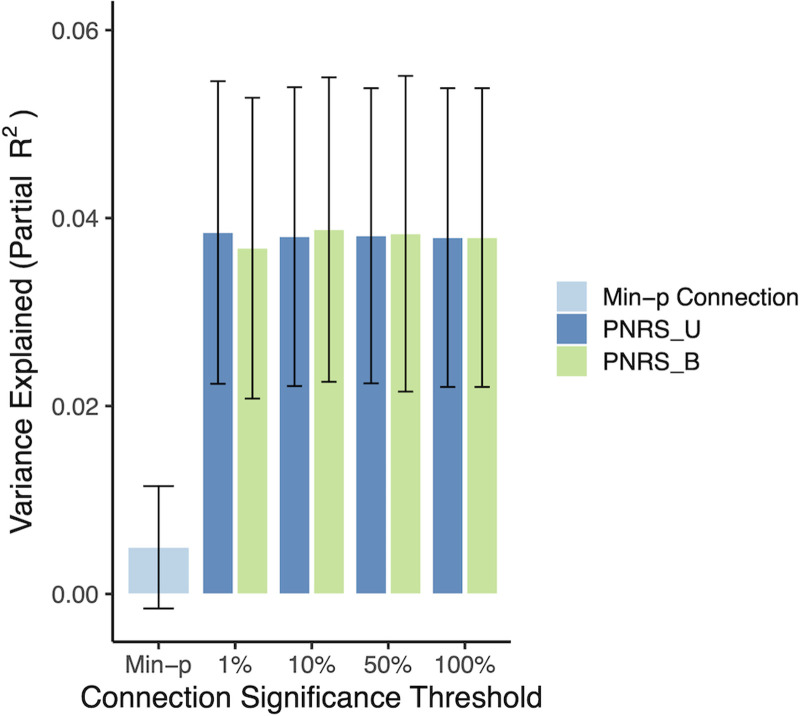
Figure 8.
The proportion of ADHD symptom score variance explained in the Oregon cohort, by the single most significantly associated connection (Min-p); polyneuro scores comprised of the top 1%, 10%, and 50% most significant connections; and all connections. The results are shown for PNRS based on the BWAS that adjusted for mean FD. Bootstrapped standard errors are shown.

