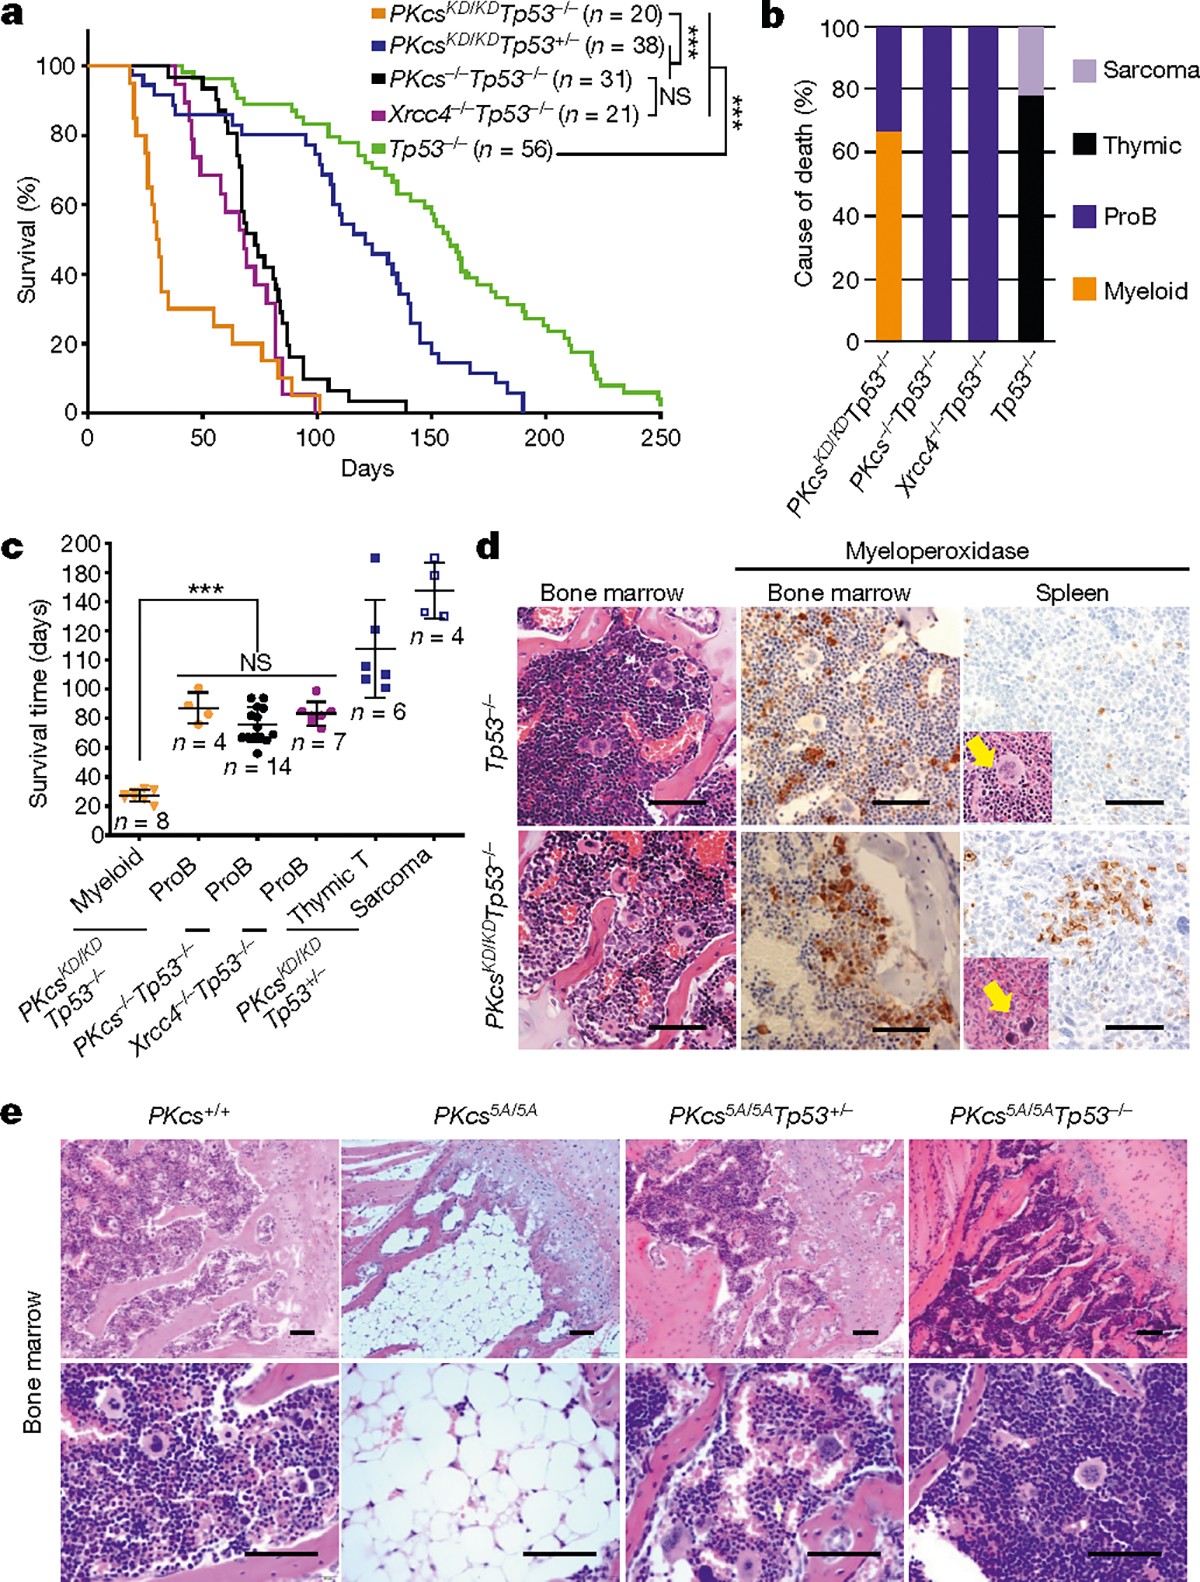
Fig. 1 |. Kinase dead or phosphorylation deficient DNA-PKcs causes haematopoietic defects independent of cNHEJ.

a, Kaplan–Meier survival curve of DNA-PKcsKD/KDTp53−/− and control (DNA-PKcsKD/KDTp53+/−, DNA-PKcs−/−Tp53−/−, Xrcc4−/−Tp53−/− and Tp53−/−) mice. Log-rank (Mantel–Cox) test; ***P < 0.001, NS (not significant) P > 0.05. b, Cause of death for tumour cohorts by genotype. c, The life expectancy for mice of different genotypes plotted by tumour type. Pro-B cell lymphomas in DNA-PKcsKD/KDTp53−/− mice have similiar latency as in DNA-PKcs−/−Tp53−/− and Xrcc4−/−Tp53−/− mice (two-sided unpaired Student’s t-test; ***P < 0.001, NS P > 0.05). Data shown as mean ± s.e.m. d, Representative histological analyses of bone marrow and spleen from 3-week-old DNA-PKcsKD/KDTp53−/− mice. The samples were stained for the myeloid marker myeloperoxidase before being counterstained with haematoxylin (for nuclei). Arrows indicate megakaryocytes. Scale bars, 100 μm. e, Representative histology analyses of bone marrow from 2-week-old DNA-PKcs+/+ and DNA-PKcs5A/5A mice with or without Tp53 deficiency. Scale bars, 100 μm. Exact P values and defined sample sizes (n) are provided in Supplementary Data 1.
