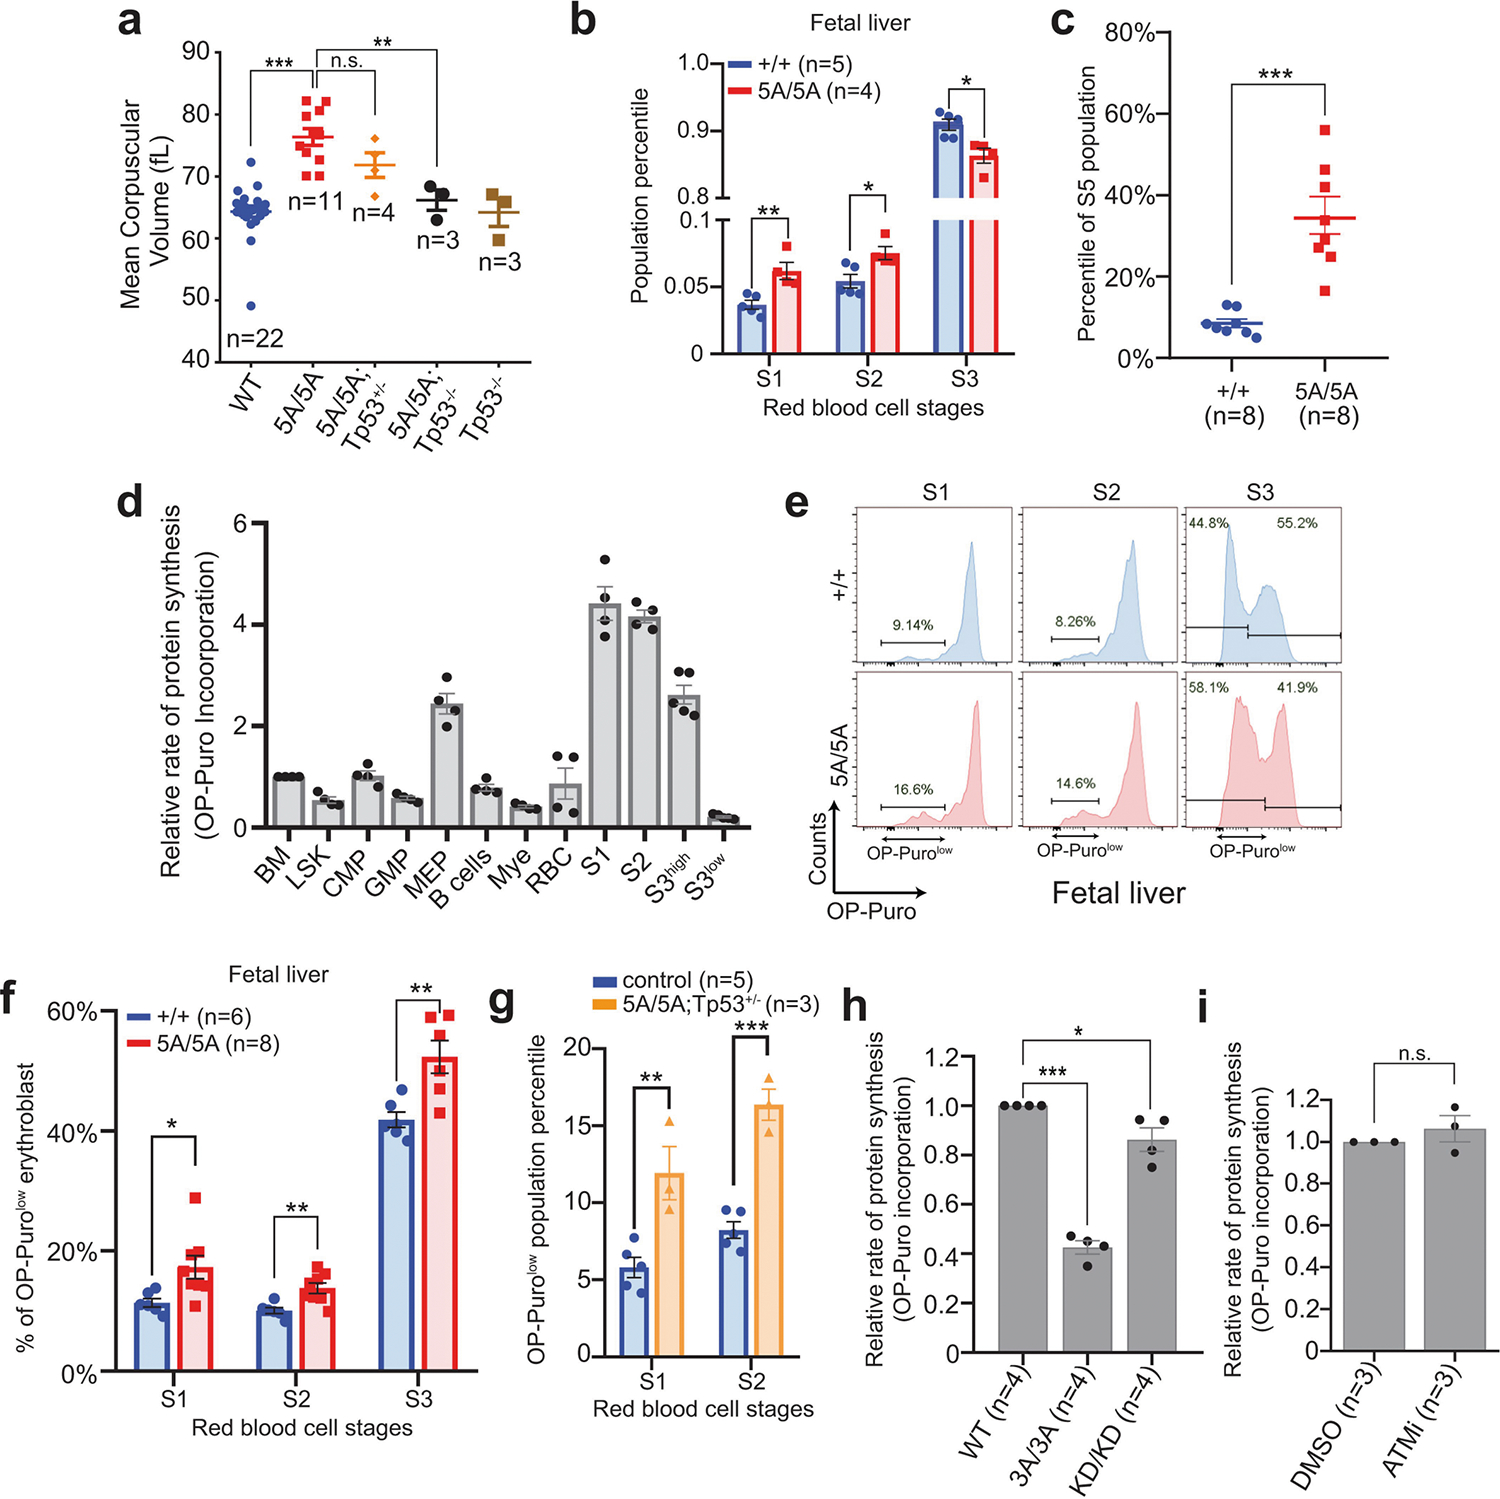
Extended Data Fig. 7 |. Global translation defects in DNA-PKcs5A/5A haematopoietic cells.

a, MCV of RBCs from 2-week-old DNA-PKcs5A/5A mice with or without TP53 deficiency. Wild-type and 5A/5A data from Fig. 2e included for comparison. b, Relative percentage of S1, S2 and S3 cells among all erythroblasts in fetal liver from DNA-PKcs5A/5A or DNA-PKcs+/+ E14.5 embryos. S4 and S5 populations have not yet evolved significantly in the E14.5 fetal liver. c, The relative frequencies of S5, the most mature erythroblast, in P14 bone marrow from DNA-PKcs5A/5A or DNA-PKcs+/+ mice. d, Relative OP-puro levels in P14 wild-type bone marrow haematopoietic cells. The average of total bone marrow was set to 1. The erythroblasts (S1, S2 and S3high) clearly have the highest OP-Puro levels. As shown in Fig. 2h, S3 erythroblasts have an OP-purohigh and an OP-purolow population. The mean OP-puro levels of both populations are included. e, Representative global protein translation in S1, S2 and S3 erythroblasts from E14.5 DNA-PKcs+/+ and DNA-PKcs5A/5A fetal liver. f, Frequency of OP-Purolow among S1, S2, and S3 erythroblasts in E14.5 fetal liver. OP-Puro labelling of fetal liver cells was performed for 30 min. g, Quantification of the frequency of OP-Purolow among S1and S2 erythroblasts from 2-week-old DNA-PKcs5A/5ATp53+/− mice. h, Relative OP-puro levels (normalized to the levels in untreated DNA-PKcs+/+ B cells) of DNA-PKcsKD/KD and DNA-PKcs3A/3A B cells. Unpaired Student’s t-test, ***P < 0.001, *P < 0.05. i, Relative OP-puro levels of DNA-PKcs+/+ B cells treated with ATM kinase inhibitor (KU55933, 15 μM for 17 h). Data represent three independent biological experiments (P = 0.38 for unpaired Student’s t-test). a–d, f–i, Two-sided unpaired Student’s t-test, ***P < 0.001, **P < 0.01, *P < 0.05, n.s. P > 0.05. All graphs show mean ± s.e.m. Exact P values and defined sample sizes (n) are provided in Supplementary Data 1.
