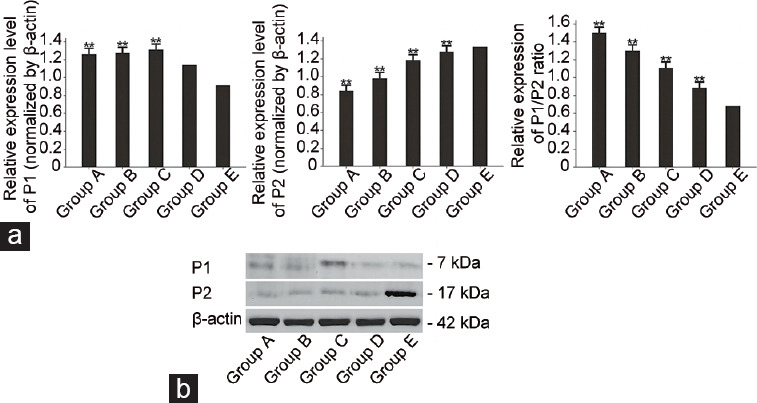
Figure 3.

Protamines in infertile males with varying degrees of abnormal sperm morphology. (a) Histograms showed differences between case and control groups for P1, P2, and the P1/P2 ratio. **P < 0.01 (the indicated value vs that of Group E). (b) Representative western blot images showed P1 and P2 proteins in infertile males with different degrees of abnormal sperm morphology. Group A: abnormal spermatozoa=100%; Group B: abnormal spermatozoa >96% and ≤99%; Group C: abnormal spermatozoa >93% and ≤96%; Group D: abnormal spermatozoa ≤93%; Group E: control group. P1: protamine 1; P2: protamine 2.
