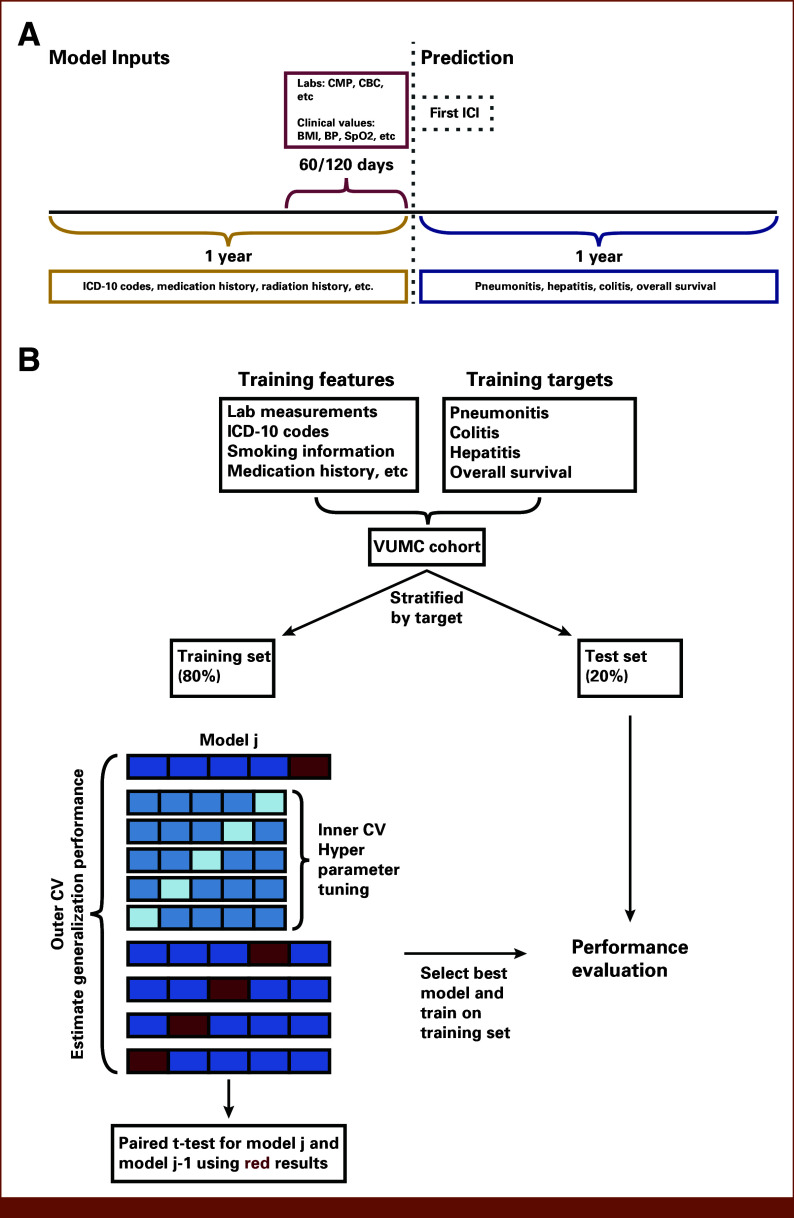
FIG 2.
Design of the predictive models and model development framework. (A) For each patient, ICI initiation date was set as the prediction time point (dotted line). A 60- or 120-day time window (red curly brace) was applied to aggregate laboratory and clinical measurements data (top red box), indicated in the pre-ICI period; a 1-year time window (gold curly brace) before ICI initiation (gray dotted box) was applied to other data types (eg, diagnosis codes, drugs; bottom left gold box). The features were used to train ML models to predict four binary outcomes (bottom right blue box). The binary outcome label indicates the occurrence of at least one episode (for toxicities) within 1 year of ICI initiation (blue curly brace). (B) For each outcome, patients were randomly partitioned into training (80%) and test (20%) sets using stratified split on the basis of the binary target. Nested CV was used in model development, hyperparameter optimization was performed in the inner loop, and generalization performance was estimated in the outer loop. Each experiment included a baseline and an alternative model. The alternative model was selected if it demonstrated statistically significant superiority over the baseline model based on a paired t-test using the outer loop AUC results. BP, blood pressure; CMP, complete metabolic panel; CV, cross-validation; ICD-10, International Classification of Diseases; ICI, immune checkpoint inhibitor; ML, machine learning; SpO2, oxygen saturation.

