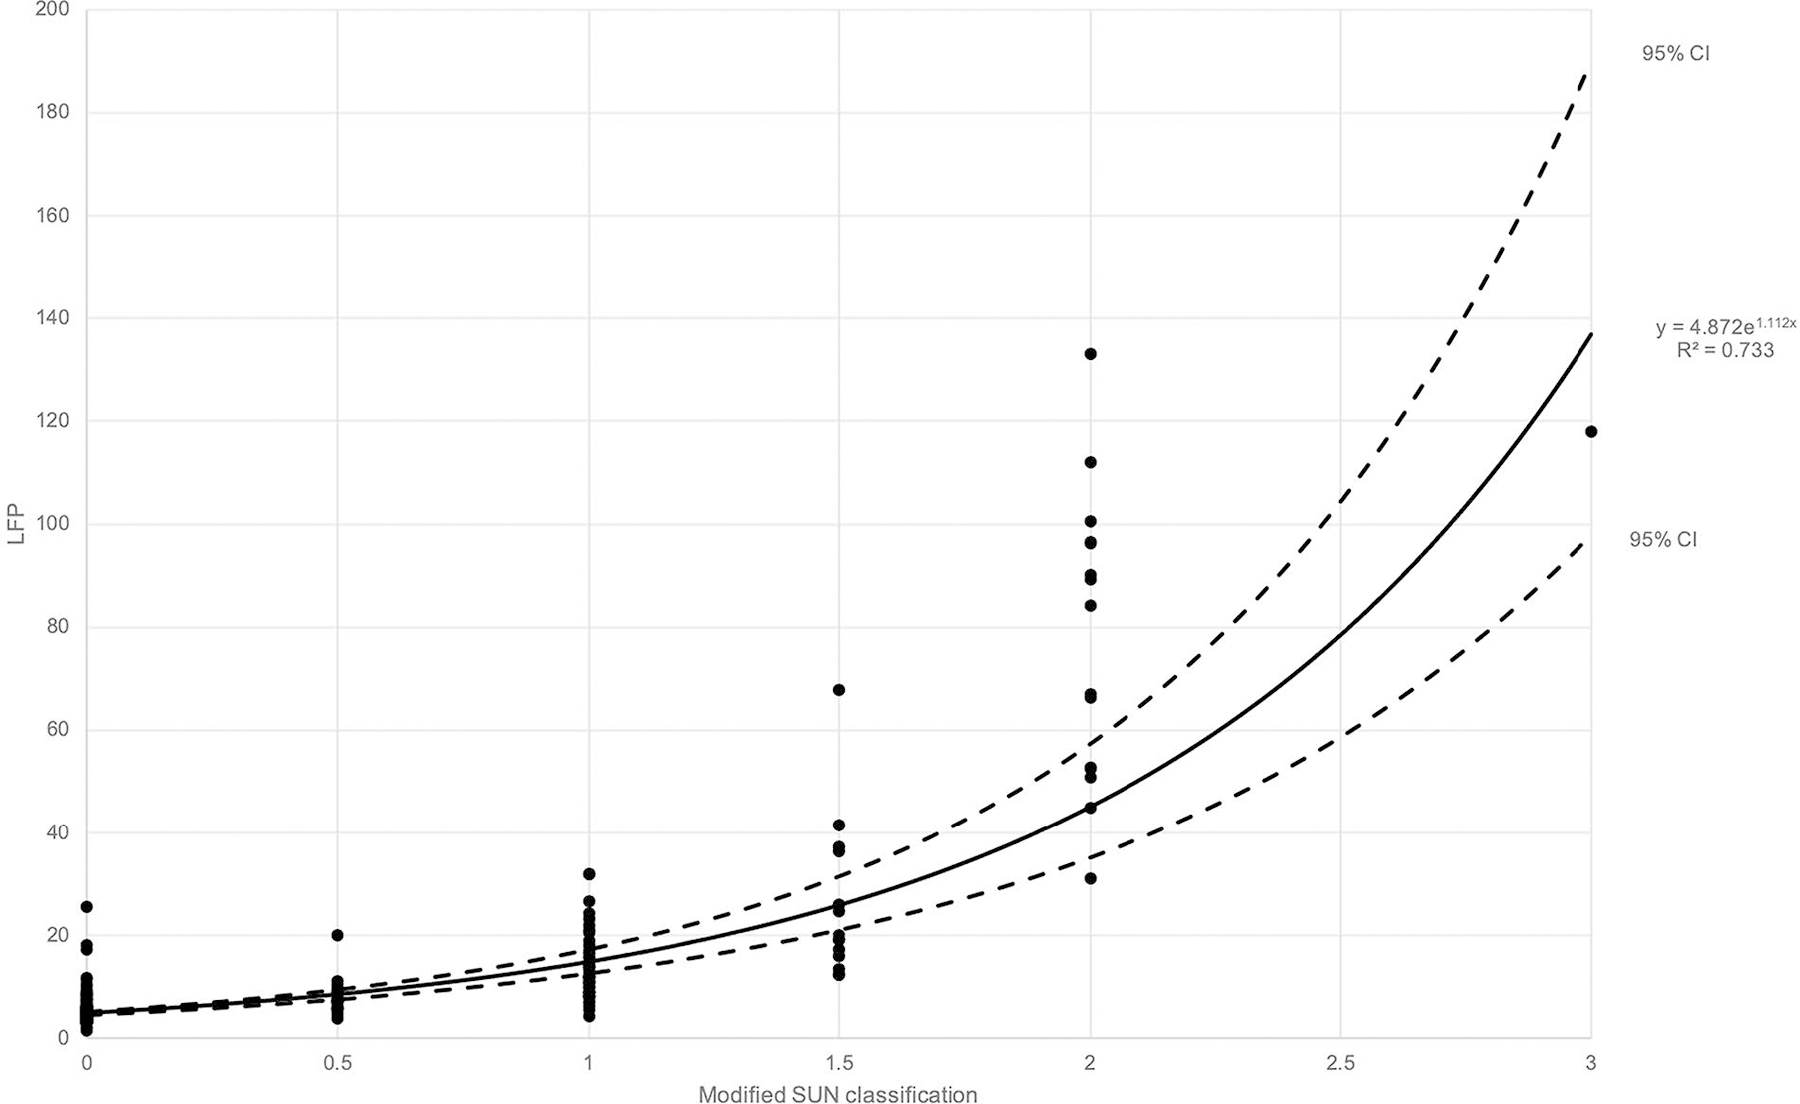
Figure 2.

Scatter plot and nonlinear regression model of cases comparing modified Standardization of Uveitis Nomenclature classification and laser flare photometer measurements (n = 228). An exponential equation curve had the best match with R2 value equal to 0.733. 95% confidence interval curves were also added.
