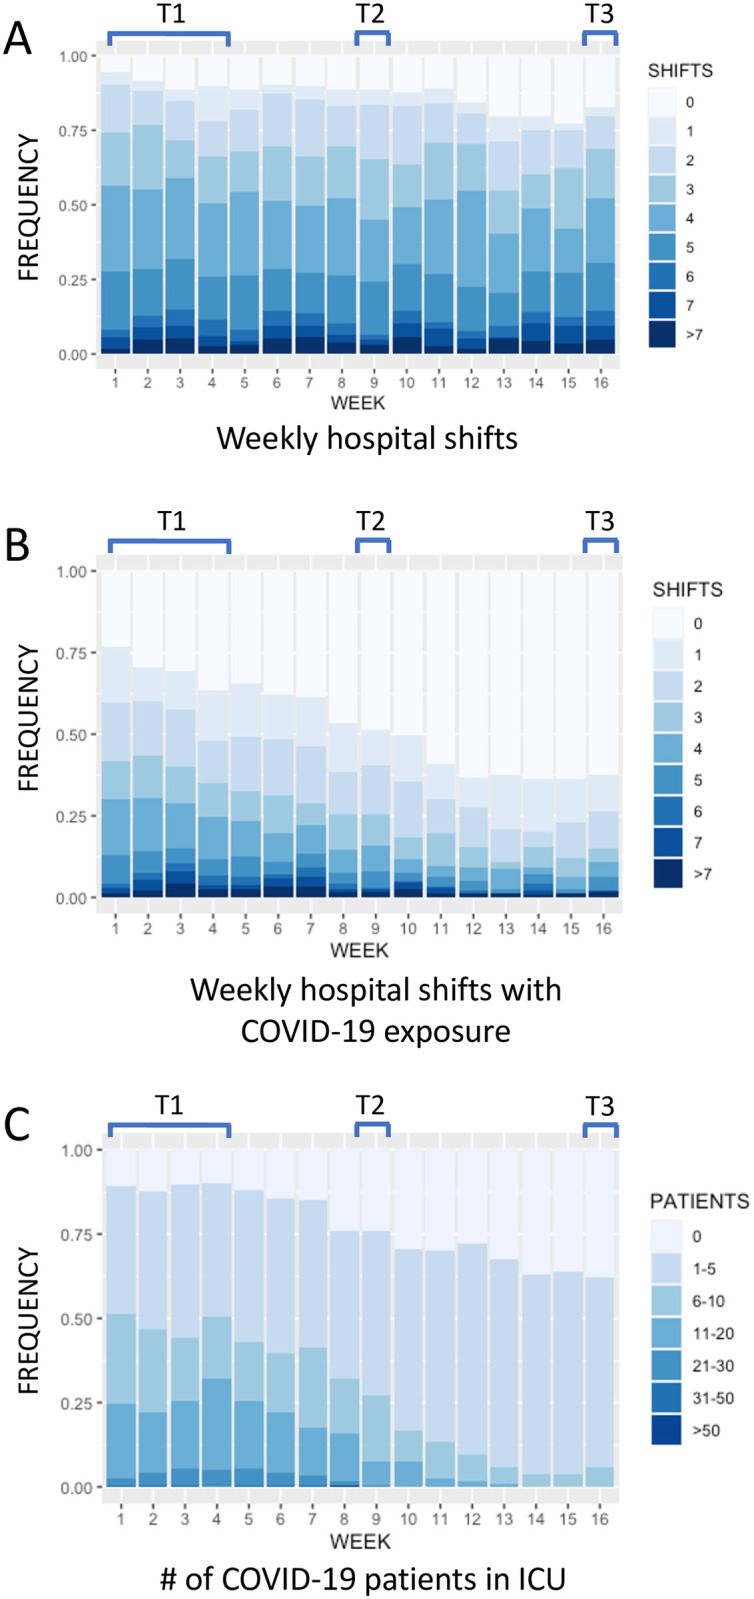
Fig 1. Weekly COVID-19 workload data reported by participants during the 16 weeks of the study.

(A) Weekly hospital shifts. (B) Weekly hospital shifts with exposure to COVID-19 patients. (C) The maximum number of COVID-19 patients admitted to the participant’s ICU. Study weeks are shown on the x axis and the frequency of each response is shown on the y axis. T1, T2 and T3 indicate the timing of the GHQ-12 surveys.
