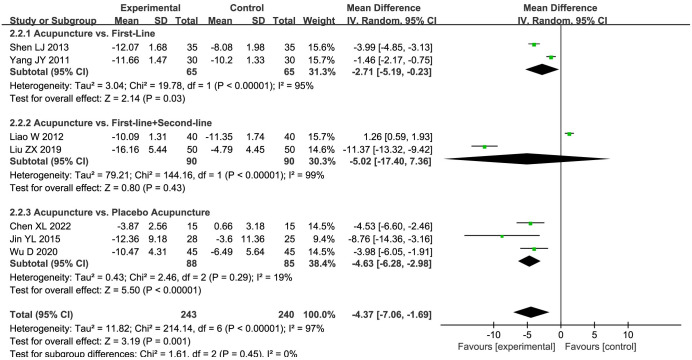
. 2024 Mar 7;19(3):e0298438. doi: 10.1371/journal.pone.0298438
© 2024 Xu et al
This is an open access article distributed under the terms of the Creative Commons Attribution License, which permits unrestricted use, distribution, and reproduction in any medium, provided the original author and source are credited.

