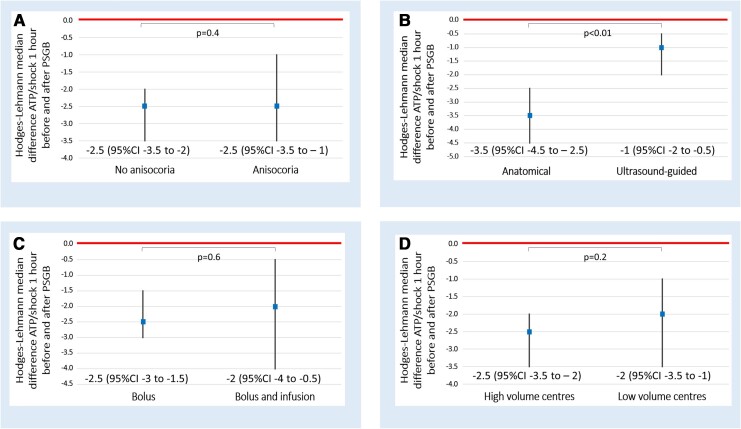
Figure 5.
Subgroup per-procedure analysis providing the comparison of Hodges–Lehmann median differences of the number of ATPs/shocks 1 h before and after PSGB between the different subgroups. Panel (A): anisocoaria vs no anisocora; panel (B): anatomical vs ultrasound-guided approach; panel (C): bolus vs bolus and infusion and panel (D): high volume vs low volume centres

