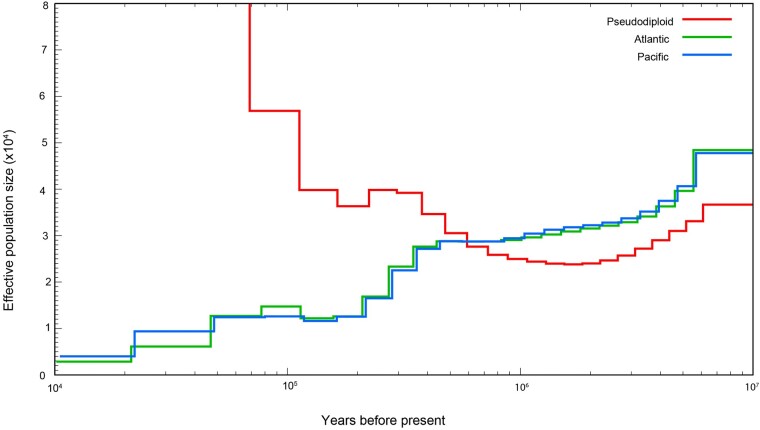
Fig. 6.
Historical demography of Pacific and Atlantic blue whales from PSMC analysis of genomes. The pseudodiploid plot represents coalescence between the 2 genomes, where the rapid increase starting approximately 125 kyr ago indicates cessation of gene flow (coalescence) between the populations. Generation time = 30.8 yr; Autosomal mutation rate (µA) = 1.58E-08 substitutions/bp/generation.

