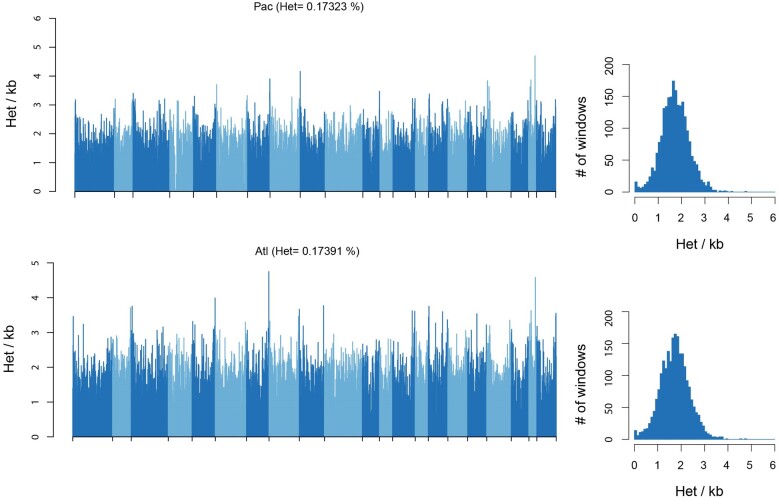
Fig. 7.
Distributions of heterozygosity across the genomes of the North Pacific and North Atlantic blue whales. (left) Barplot shows per-site heterozygosity in nonoverlapping 1-Mb windows across 22 scaffolds >10 Mb in length. Scaffolds are shown in alternating shades. (right) Histogram of the count of per-window heterozygosity levels.

