
Fig. 2.
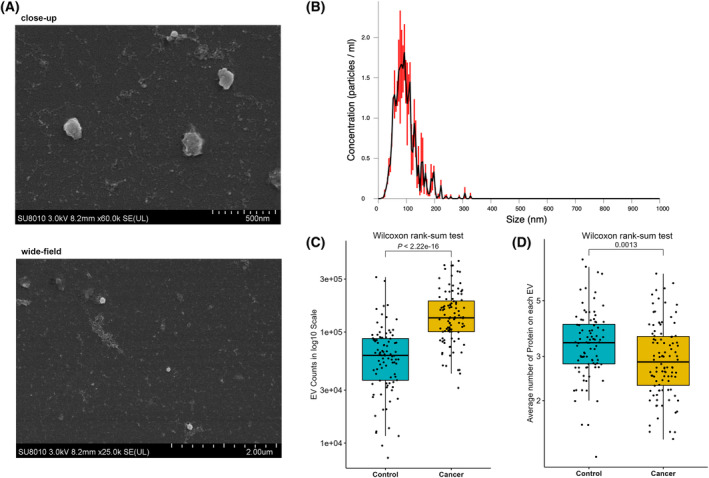
Characterization of EVs detected in plasma. (A) Morphology of EVs captured by scanning electron microscopy, both in close‐up (scale bar indicates 500 nm) and wide‐field (scale bar indicates 2.00 μm) views. (B) Diameter distribution of EVs obtained by nanoparticle tracking analysis method. (C) Comparison of EV counts between pan‐cancer (n = 100) and control (n = 100) groups, P < 0.001. (D) Comparison of the average number of proteins on each EV between pan‐cancer (n = 100) and control (n = 100) groups out of the 207 possibly detectable proteins by PBA, P < 0.01.