
Fig. 5.
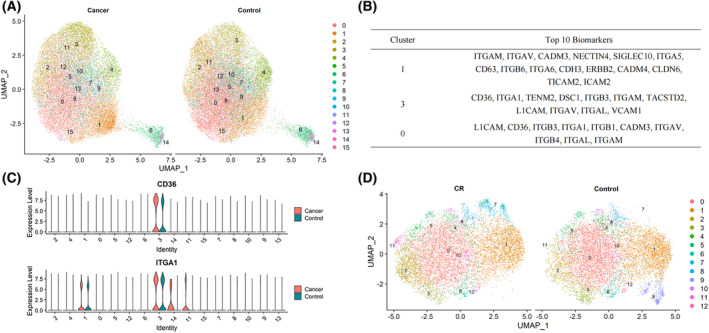
Results of EV subpopulation analyses. The down‐sampling strategy was applied to select 20 000 EVs from pan‐cancer samples (n = 100) and 20 000 EVs from the control samples (n = 100). (A) Distribution of EV subpopulations between cancer and control groups. (B) Characteristic markers of cluster 1, cluster 3, and cluster 0 in (A). (C) Distribution of CD36 and ITGA1 between cancer and control groups in all clusters. The down‐sampling strategy was also applied to select 10 000 EVs from colorectal cancer samples (n = 20) and 10 000 EVs from the control samples (n = 100). (D) Distributions of EV subpopulations between colorectal cancer and control groups.