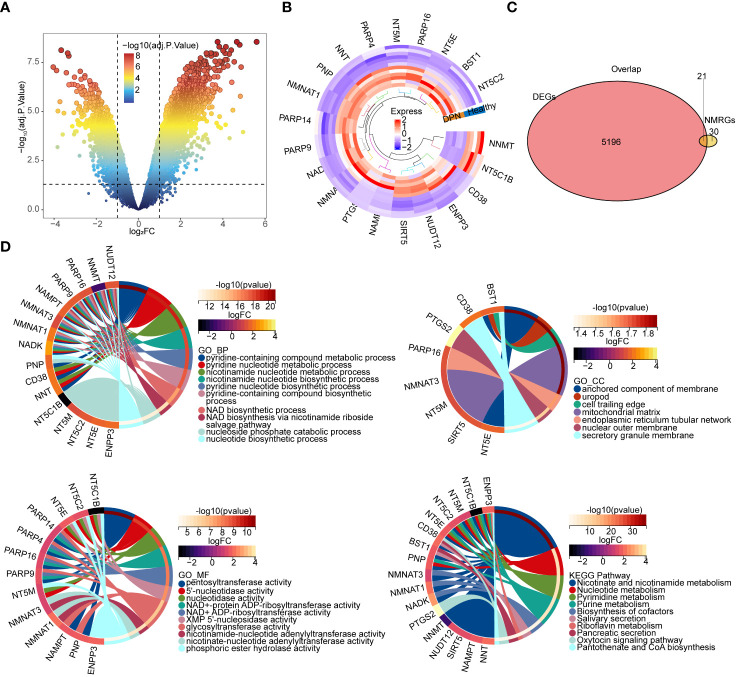
Figure 1.
Identification and enrichment analysis of DE-NMRGs. (A) Volcano plot of differentially expressed genes. The upper-left nodes represent downregulated DEGs, the upper-right nodes represent upregulated DEGs. (B) Heat map and clustering analysis DEGs and NMRGs. The marked genes are the hub genes obtained by subsequent analysis. (C) Venn diagram of shared gene between DEGs. DEGs: Differentially expressed genes screened from GSE95849. NMRGs: NAD+ metabolism related genes downloaded from previous article (17) (D) Chord diagram of the top 10 enriched terms of DE-NMRGs. The upper left plot is BP enrichment; the upper right plot is CC enrichment; the lower left plot is MF enrichment; the lower right plot is KEGG pathway enrichment analysis chord diagram. BP, Biological Process; CC, Cellular Component; MF, Molecular Function.

