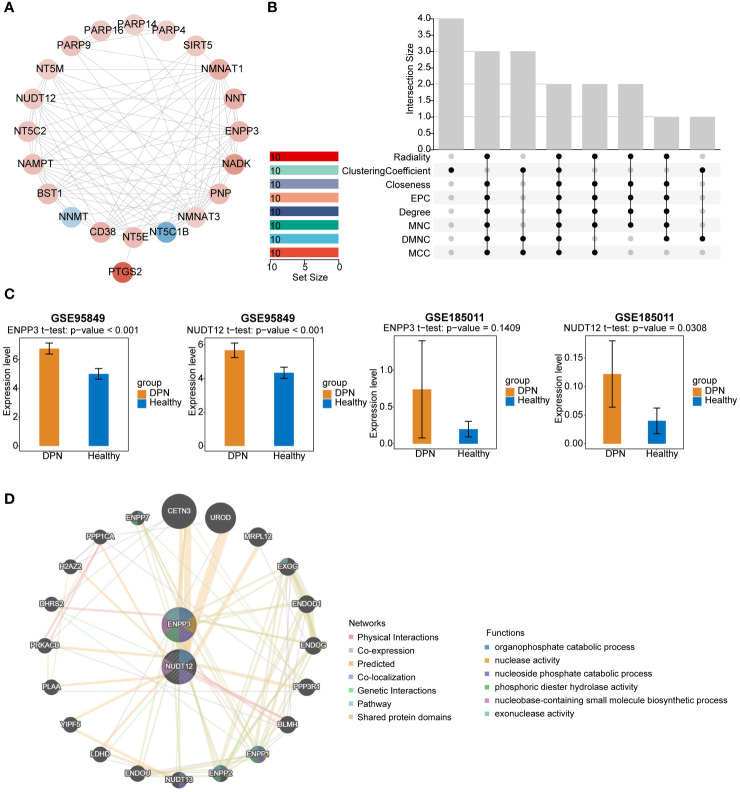
Figure 2.
PPI network analysis and validation of potential biomarkers. (A) PPI network diagram of DE-NMRGs. Red indicates genes that are up-regulated, whereas blue indicates genes that are down-regulated. (B) Venn diagram showing the overlap of potential biomarkers were identified by 8 different algorithms. (C) Validation of ENPP3 and NUDT12 expression in GSE95849 and GSE185011. (D) PPI regulatory network of ENPP3 and NUDT12.

