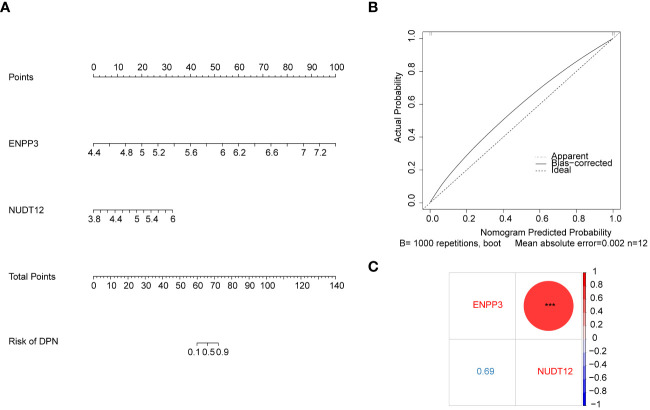
Figure 3.
Diagnostic model construction and correlation analysis based on biomarkers. (A) Nomogram based on the expression of biomarkers ENPP3 and NUDT12. (B) Calibration curve of the nomogram model in (A) The x-axis shows the nomogram-predicted probability of DPN. The y-axis shows the actual probability of DPN occurrence (C) Bubble chart showing correlation analysis between the expression levels of biomarkers ENPP3 and NUDT12.

