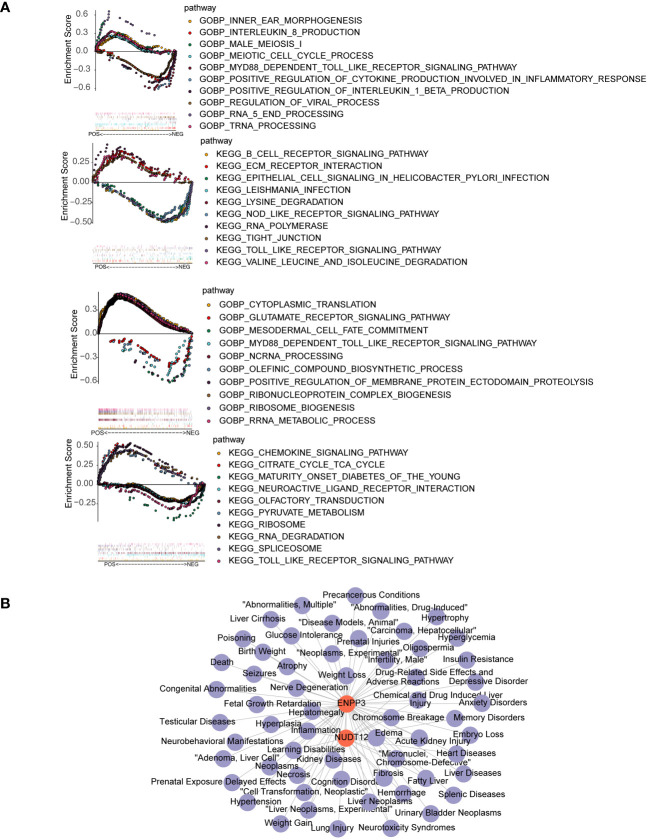
Figure 4.
GSEA enrichment and disease association analysis of biomarkers. (A) GSEA enrichment results for biomarkers ENPP3 (upper) and NUDT12 (lower). The left figures show top 10 enriched GO biological processes (BP); the right figures show top 10 enriched KEGG pathways. (B) Biomarker-disease association network. Red nodes represent biomarkers and purple nodes represent associated disease.

