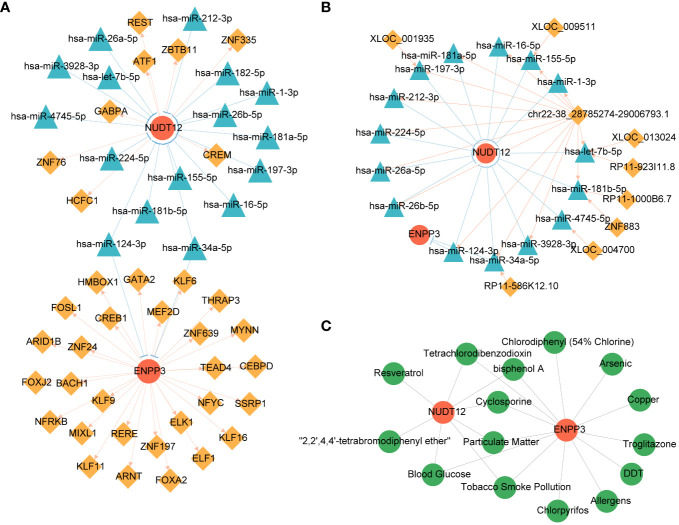
Figure 5.
Regulatory network and drug prediction analysis of biomarkers. (A) miRNA-mRNA-TF regulatory network of biomarkers. Red nodes represent biomarkers; yellow diamonds TFs; blue triangles represent miRNAs. (B) ceRNA network of biomarkers. Red nodes represent biomarkers; yellow diamonds represent lncRNAs; blue triangles represent miRNAs. (C) Drug-target network of biomarkers. Red nodes represent biomarkers; green nodes represent drugs.

