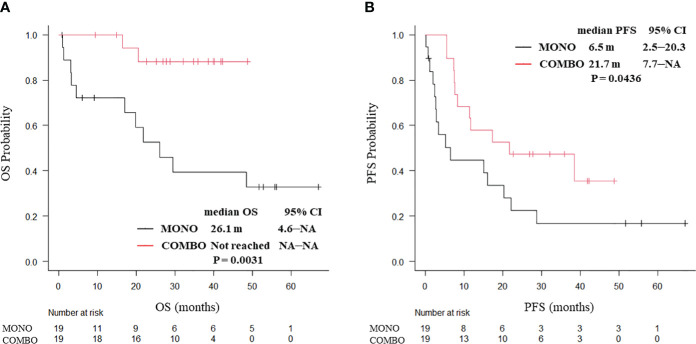
Figure 3.
Kaplan–Meier curves for (A) OS and (B) PFS of ECOG PS 0 patients aged ≥70 years with PD-L1 TPS ≥ 50% who received ICI monotherapy or combination therapy of ICI and chemotherapy after PSM (N = 38). OS, overall survival; PFS, progression-free survival; CI, confidence interval; PD-L1 TPS, programmed cell death ligand-1 tumor proportion score; ICI, immune checkpoint inhibitor; PSM, propensity score matching; MONO, ICI monotherapy; COMBO, ICI and chemotherapy combination therapy.

