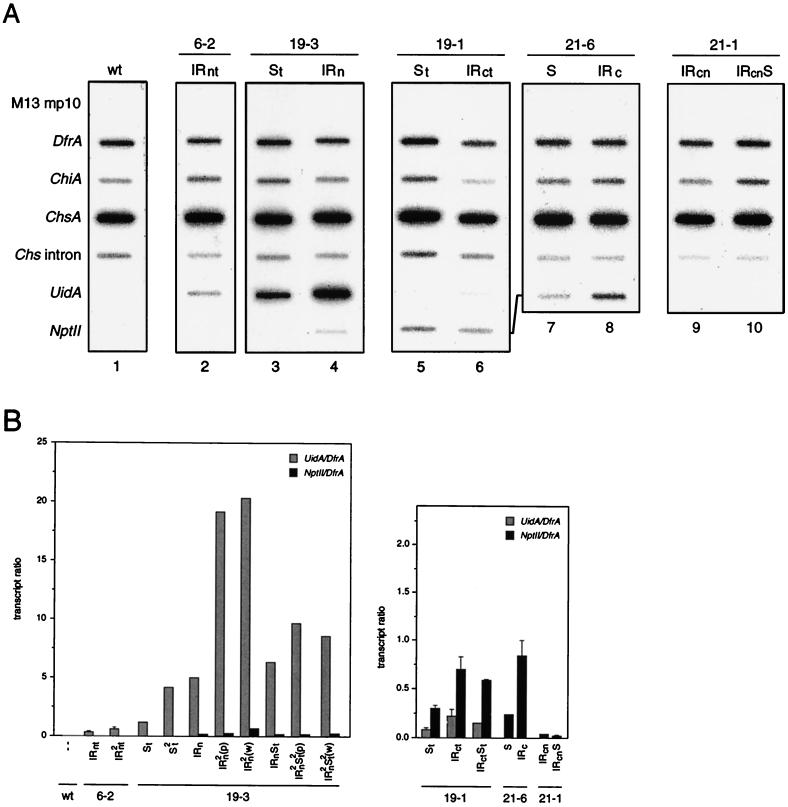
FIG. 3.
Transcriptional activity of transgenes as determined by nuclear run-on assays. (A) Representative examples of nascent RNA hybridizations. Corolla nuclei were obtained from the transformants listed at the top. These plants were hemizygous for the T-DNA loci indicated. Nuclei from untransformed V26 (wild type [wt]) were used as control. The slot blot filters contained gene and strand-specific single-stranded M13 DNAs that were able to hybridize to the RNAs indicated at the left. DfrA and ChiA served as internal controls, and the ChsA intron signal indicates the transcription level of the endogenous Chs genes. M13mp10 was the vector in which the gene sequences were cloned. In addition to the hybridizations shown here, several others were performed with material from transformants carrying the same or other T-DNA loci, as depicted below the bar diagrams. (B) The signals obtained with the uidA, nptII, and DfrA M13 DNAs were quantified with a PhosphorImager, and the ratios of the uidA to DfrA transcripts (grey bars) and nptII to DfrA transcripts (black bars) were calculated. The values are expressed as the mean and SEM when n > 1 (n ranged from 2 to 5).

