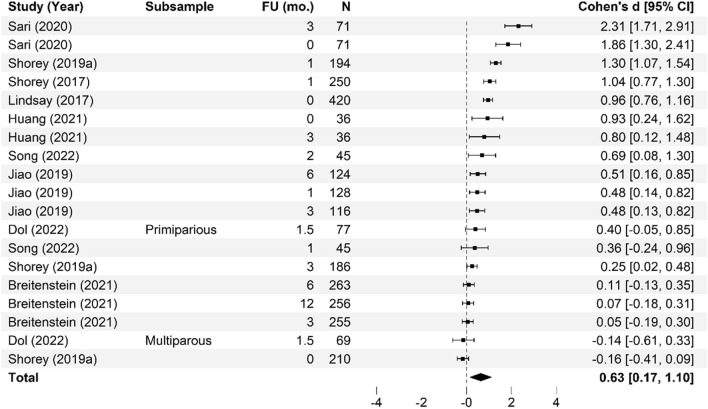
Fig. 6.
Parent self-efficacy forest plot. Cohen’s d effect sizes are shown for all included studies and their subsamples. The summary effect size and 95% confidence intervals are presented. Where more than one non-independent subsample was reported in a single study, all samples are shown, with a description of each shown in the subsample column. FU (mo.) = Follow-up time in months from intervention completion to data collection

