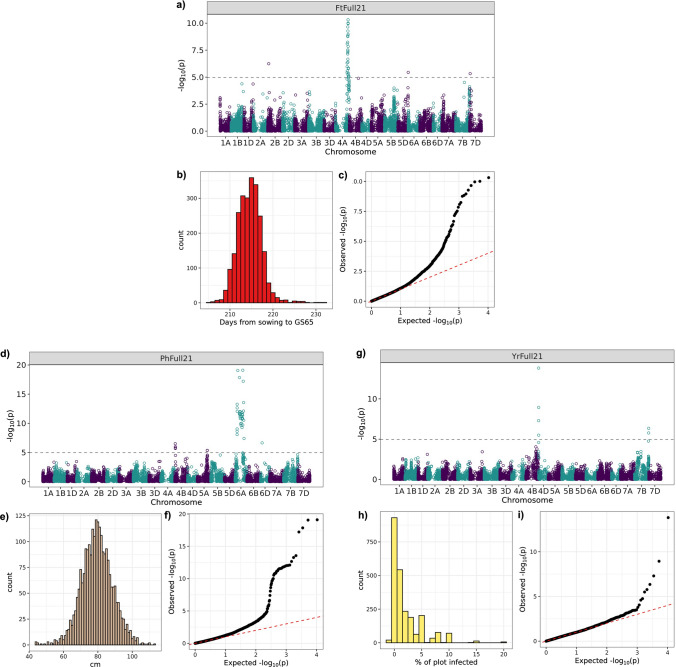
Fig. 5.
QTL mapping results from the Full21 trial for the three traits: flowering time (Ft; a), (b) and (c)), plant height (Ph; d), (e) and (f)) and yellow rust infection (Yr; g), (h) and (i)). For each trait, a Manhattan plot is shown, with genetic markers ordered based on physical map position (a), (d) and (g)). Bonferroni-like corrections using effective markers determined by linkage disequilibrium were used to estimate the significance thresholds for a corrected P = 0.05. The phenotype distributions of all genotypes used in the mapping (b), (e) and (h)) and the quantile–quantile plot for each QTL scan (c), and (f) and (i)) were also plotted for each trait

