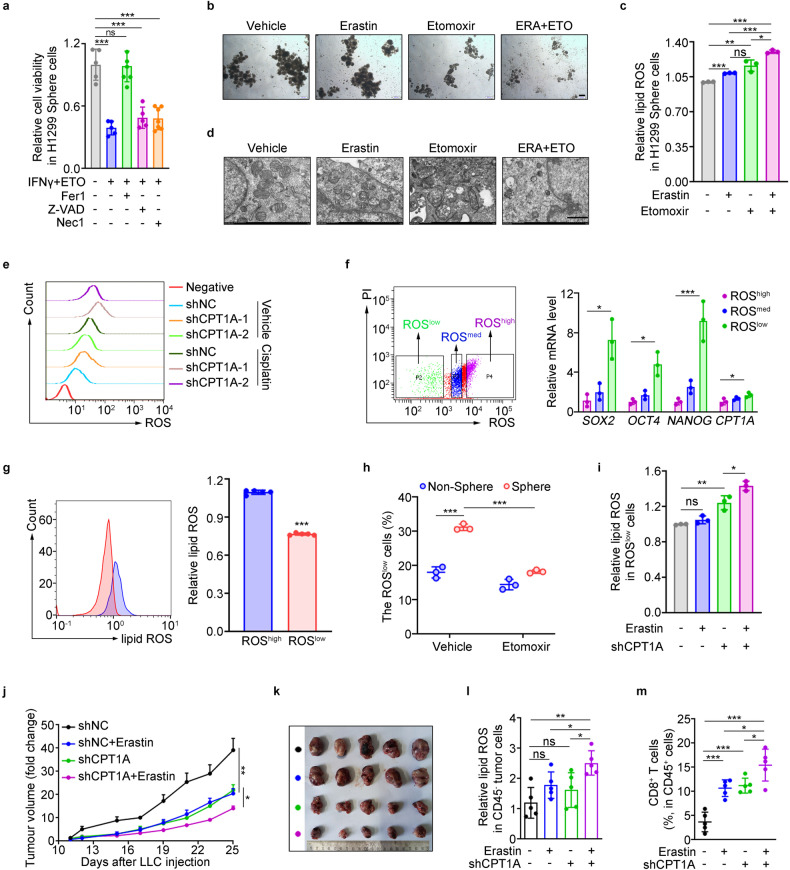
Fig. 2.
CPT1A is an essential driver for ferroptosis resistance in LCSCs. a Cell viability of H1299 sphere cells treated with IFNγ (100 μM) and etomoxir (100 μM) in the presence of ferrostatin-1 (Fer1, 2 mM), necostatin-1 (Nec1, 1 mM), or z-VAD-FMK (z-VAD, 10 mM) for 2 days detected by colorimetry. Data represent the mean ± s.d.; n = 5–7 samples. b Representative tumor-sphere images of LLC cells treated with etomoxir (100 μM) for 2 days and then erastin (2 μM) for 6 h. Scale bars, 200 μm (insets). c Lipid ROS levels in H1299 sphere cells treated with etomoxir (100 μM) for 2 days and then erastin (2 μM) for 6 h determined by flow cytometry. Data represent the mean ± s.d.; n = 3 samples. d Representative images of transmission electron microscope analyzed in H1299-shNC/shCPT1A cells treated with etomoxir (100 μM) for 2 days and additional erastin (2 μM) for 6 h. Scale bar, 1 μm (insets). e ROS levels in H1299-shNC/shCPT1A cells treated with DMSO or cisplain for 2 days. f Quantification of mRNA for SOX2, OCT4, NANOG and CPT1A in ROShigh, ROSmedium or ROSlow cells isolated by flow cytometry, respectively. g Lipid ROS levels in ROShigh or ROSlow cells of H1299 cells determined by flow cytometry. Data represent the mean ± s.d.; n = 5 samples. h Percentage of ROSlow cells in sphere or non-sphere cells of LLC cells treated with etomoxir (100 μM) or not for 2 days determined by flow cytometry. Data represent the mean ± s.d.; n = 3 samples. i Lipid ROS levels in ROSlow cells of LLC-shNC/shCPT1A cells treated with erastin (2 μM) or not for 6 h determined by flow cytometry. Data represent the mean ± s.d.; n = 3 samples. Effects of erastin (IP, 20 mg/kg) on tumor progression in tumor-bearing mice inoculated with LLC-shNC/shCPT1A cells. Tumor growth curve (data represent the mean ± s.e.m.; n = 5 samples) (j). Photograph of the mouse tumor (k). Lipid ROS levels of CD45- cells (l) and percentage of CD8+ T cells in the tumor (m). Data represent the mean ± s.d.; n = 5 samples. *P < 0.05, **P < 0.01, ***P < 0.001; ns: not significant. The statistical analysis was performed using a two-tailed Student’s t-test or Pearson’s correlation test

