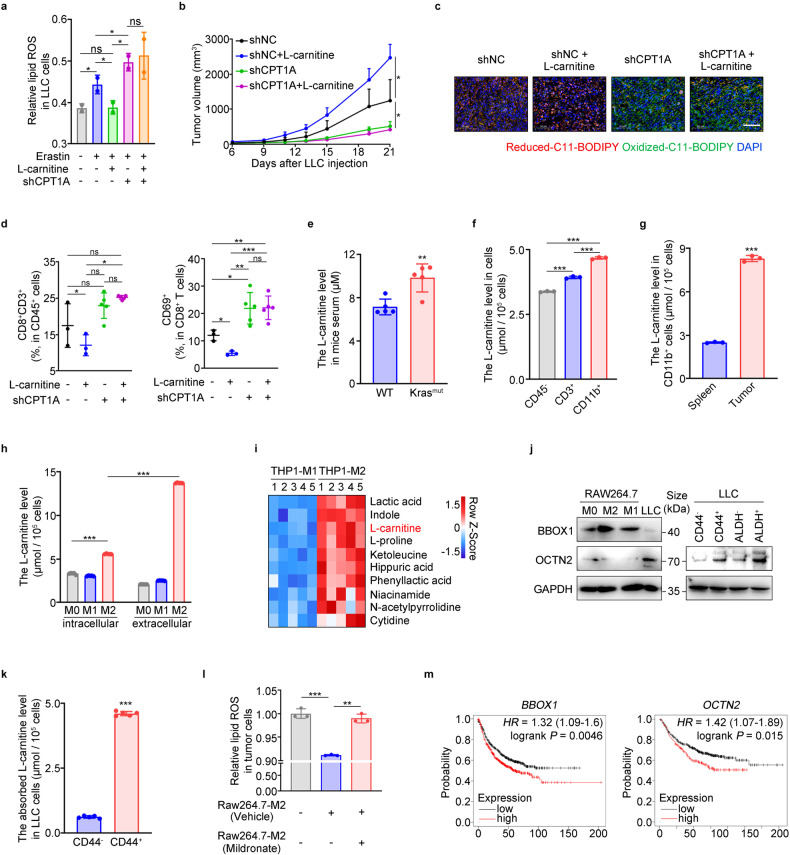
Fig. 6.
CPT1A-mediated ferroptosis resistance in LCSCs relies on TAMs-derived L-carnitine. a Lipid ROS levels in LLC-shNC/shCPT1A cells treated with L-carnitine (10 mM) or not for 2 days and then erastin (2 μM) for 6 h determined by flow cytometry. Data represent the mean ± s.d.; n = 2 samples. Effects of L-carnitine (IG, 100 mg/kg) on tumor progression in tumor-bearing mice inoculated with LLC-shNC/shCPT1A cells. Tumor growth curve (data represent the mean ± s.e.m.; n = 5 samples) (b). Representative images of C11-BODIPY staining in the tumor. Scale bar: 50 μm (insets) (c). Percentages of CD8+ or CD69+CD8+ cells in the tumor. Data represent the mean ± s.d.; n = 3-5 samples (d). e L-carnitine levels in the serum of Kras mutant or wild type mice. measured by colorimetry. Data represent the mean ± s.d.; n = 5 samples.L-carnitine levels in the virous cell types of tumor-bearing mice measured by colorimetry. L-carnitine levels in CD45-/CD11b+/CD3+ cells isolated from the tumor (f) and in macrophages isolated from the spleen or the tumor (g) in mice. Data represent the mean ± s.d.; n = 3 samples. h L-carnitine levels of intracellular or extracellular of M0/M1/M2-macrophages measured by colorimetry. Data represent the mean ± s.d.; n = 3 samples. i Heatmap of metabolites up-regulated in the THP-1-M2 medium calculated by LC-MS (P < 0.05; one-way ANOVA) (n = 5 samples). j Representative western blot for BBOX1 and OCTN2 in RAW264.7-M0/M1/M2 cells or LLC cells (left). Representative western blot for OCTN2 in CD44+/- cells or ALDH+/- cells of LLC cells (right). k Absorbed L-carnitine levels in CD44+/− cells treated with L-carnitine or not for 2 days measured by colorimetry. Data represent the mean ± s.d.; n = 5 samples. l Lipid ROS levels in LLC cells co-cultured with Raw264.7-M2 cells (treated with mildronate or not) or not determined by flow cytometry. Data represent the mean ± s.d.; n = 3 samples. m Overall survival of NSCLC patients stratified according to tumor BBOX1 or OCTN2 expression analyzed with Kaplan-Meier Plotter websites. Research model of CPT1A/c-Myc loop regulating ferroptosis in LCSCs. *P < 0.05, **P < 0.01, ***P < 0.001; ns: not significant. The statistical analysis was performed using a two-tailed Student’s t-test or Pearson’s correlation test

